Progressive Hypsometry and the glacial limitation of tropical mountain ranges
Method
How progressive hypsometry works
We designed an algorithm that concisely describes how hypsometry varies with the scale of analysis. Development of this algorithm was motivated by the observation that the hypsometric maximum of large regions can shift by several kilometers depending on the boundaries of analysis. The algorithm, which we term “progressive hypsometry” (PH), involves the measurement of hypsometric maxima in nested catchments whose outlets span from the lowest to the highest elevations in a mountain range.
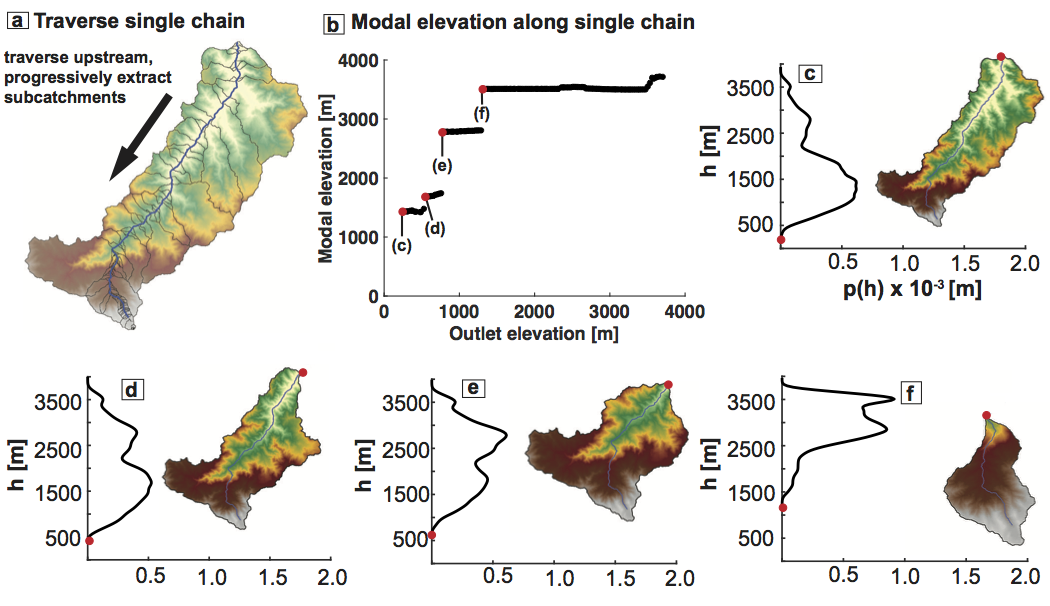
Progressive hypsometry in detail. (a) DEM of one supercatchment from the Talamanca Range. Elevation 0-4000 m is yellow through white. The dark blue streamline is an example of one chain along which progressive hypsometry is performed. The bounds of each progressively delineated catchment are drawn in black. (b) Modal elevation (hypsometric maximum) of catchments draining to progressively higher outlet elevations along dark blue streamline in (a). Each subcatchment in (a) is represented on (b). The stepped pattern in catchment modal elevation is commonly observed in all landscapes. (c-f) Elevation pdf and DEM of catchments at each jump in modal elevation in (b). Red dots indicate the catchment outlet on both the pdf and DEM, and are also represented as red dots in (b).
Algorithm
Progressive hypsometry consists of three major components: (i) segmentation of the landscape into large catchments, (ii) calculation of hypsometry along flow paths, (iii) segmentation into nested subcatchments characterized by a shared modal elevation. We first segment the targeted mountain range into large (1000 km2) catchments, hereafter referred to as “supercatchments”, delineated on the condition that they link the main divide to a low reference elevation. This method typically segments each mountain range into 30-60 supercatchments. We then do the following:
-
Map channel network:
-
define a channel network in each supercatchment using an arbitrary flow accumulation area threshold A_c—this thins the set of all possible flow paths
-
traverse downstream from each channel head i=1…N to the catchment exit to define a set of N along-channel pixel chains
-
extend each chain i upstream from its channel head to the drainage divide by following path of greatest flow accumulation area, ensuring that each pixel chain spans the full range of elevation from ridge to exit
-
-
Map PH along network:
-
traverse each chain i upstream from the exit (shared by all chains)
-
map along each chain a nested series of subcatchments, one at every channel pixel j(i)
-
for each nested subcatchment, estimate its elevation pdf, its modal elevation h_mode_j (where the pdf peaks) and its outlet elevation h_out_j
-
record as a set of i=1…N sequences of [h_out_j(i),h_mode_j(i)] pairs
-
-
Identify all PH “benches”, characteristic nested-catchment modal elevations
-
perform change-point detection along each chain i=1…N to locate and define large jumps in h_mode at each h_out
-
define the outlet elevation h_out at each jump as h_change
-
designate the groups of between-jump modal elevations {h_mode} as “benches”
-
define each bench modal elevation h_bench = min{h_mode}
-
record as a set of i=1…N sequences (one per chain) of [h_change_k(i),h_bench_k(i)] pairs, each of length k(i)=1..n(i)
-
concatenate all N sequences of *[h_change_k(i),h_bench_k(i)] *
-
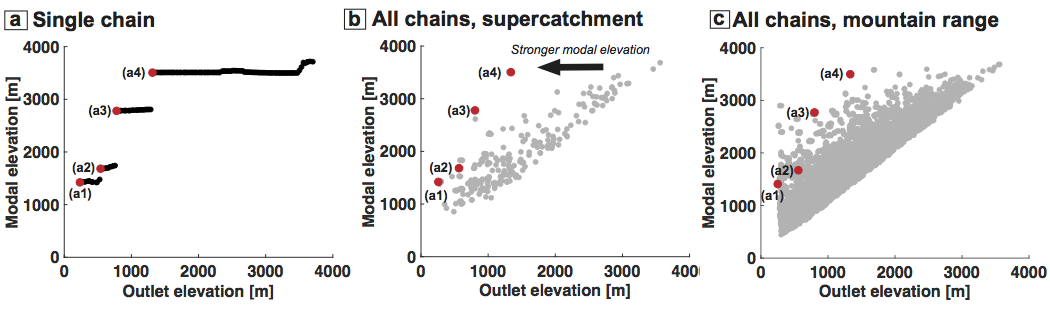
Mapping single progressive hypsometry chains on the mountain range scale. (a) Same as previous figure (b). Modal elevation is calculated for subcatchments progressively extracted along single chain. (b) On the scale of a supercatchment (e.g., previous figure (a)), jumps in modal elevation for each chain are plotted corresponding to the outlet elevation at which the jump occurs (h_change). Red points are same as (a) and correspond with catchments in the previous figure (c-f). (c) Same as b, except for all chains in entire mountain range (Talamanca Range, Costa Rica).