Progressive Hypsometry and the glacial limitation of tropical mountain ranges
Execution
Matlab scripts are separated into two folders:
Example/,
designed for simple user experience, and Core/,
which contains the scripts needed to run PH. TopoToolbox v.2.1
is required to run PHtools.
Example/
includes two scripts needed to perform the demo:
Defaults.m,
a script that be can shared by multiple driver scripts.
CostaRica.m,
used to generate the example analysis.
The example script draws from a single “supercatchment” in
Data
(see Method for terminology),
and writes a folder called CostaRica/PHanalysis, which mimics the data output in
the PHanalysis repository.
The run time for the Costa Rica example is ~30 minutes, and writes 15 Mb of output.
How to run PH example
Defaults
sets the path for PHtools, Topotoolbox, and all input (PHdata) and output (PHanalysis)
data. By default, all input and output data are contained in the PHtools folder.
CostaRica.m
runs the complete PH algorithm. It calls the script
RunPH.m,
which performs the following three steps:
Step 1: Hypsometry of progressive (nested) subcatchments (15 minute run time)
Traverse upstream from base level to main drainage divide along chains (flowpaths) in supplied DEM. Record the modal elevation of the catchment draining to the (progressively higher) position on each chain.
Create and write .txt file for each flow path. For example: PHanalysis/CostaRica/Subcatchments/25mStep
Step 2: Progressive Hypomsetric Bench (PHB) Identification (15 minute run time)
Identify groups of nested subcatchments with similar modal elevation, PHBs (see Method for explanation.)
Create and write .txt file for each PHB:
PHanalysis/CostaRica/PHBs/Cusum02_BenchLength3Steps/AllSupercatchmentsTxt/Supercatchment9PHBs.
A PHB is the modal elevation shared by a set of nested subcatchments, and this elevation
band can be mapped onto the landscape.
PHBWriteToTiff
outputs a geotiff of all PHBs in the input supercatchment.
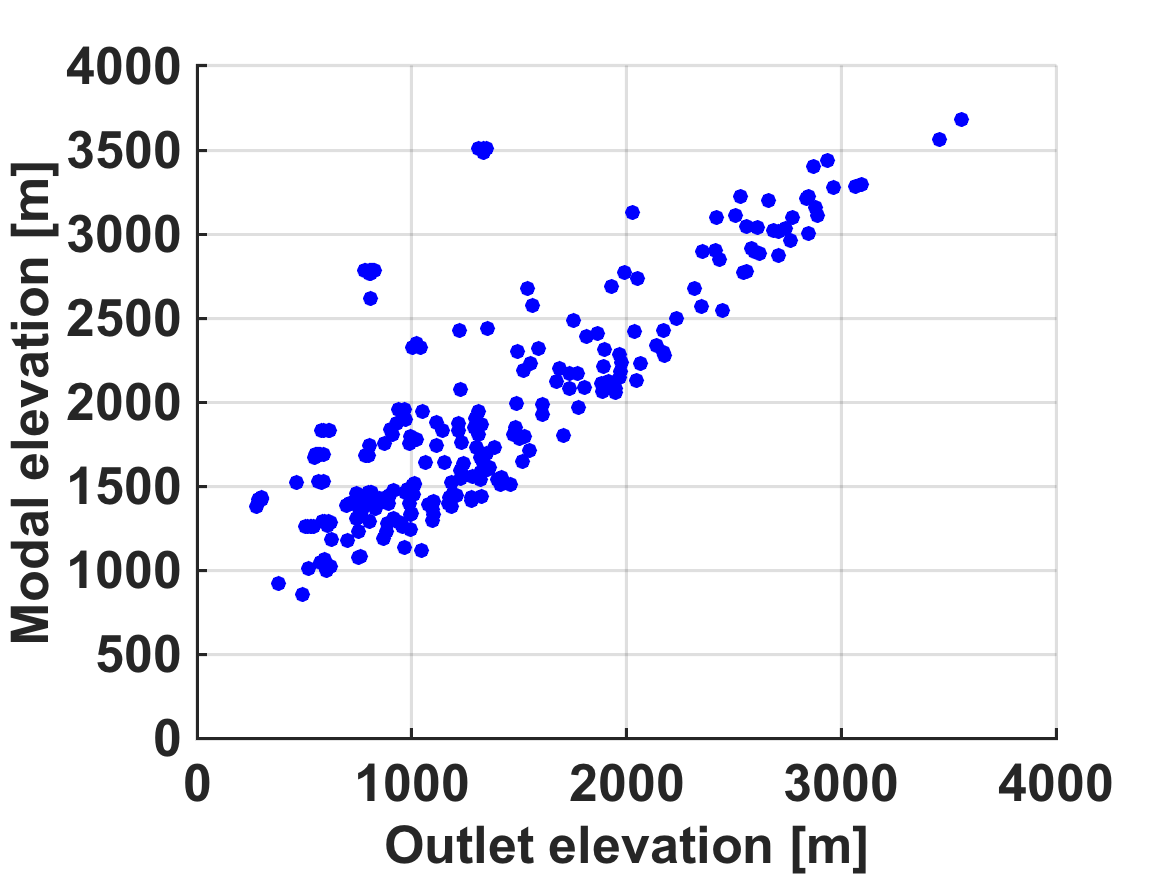
Step 3: Generate PHB plot
Read in PHB text files and generate plot of outlet vs. modal elevation for all PHBs in the supercatchment.
For this example, users can specify file type for a final figure (outputFigType) and
axes scale (peakElevationForOutputFig).
See
figure output
for the example data set in the true PHanalysis repository: