Progressive Hypsometry and the glacial limitation of tropical mountain ranges
Analyses
Revealing glacial limitation of tropical mountain ranges
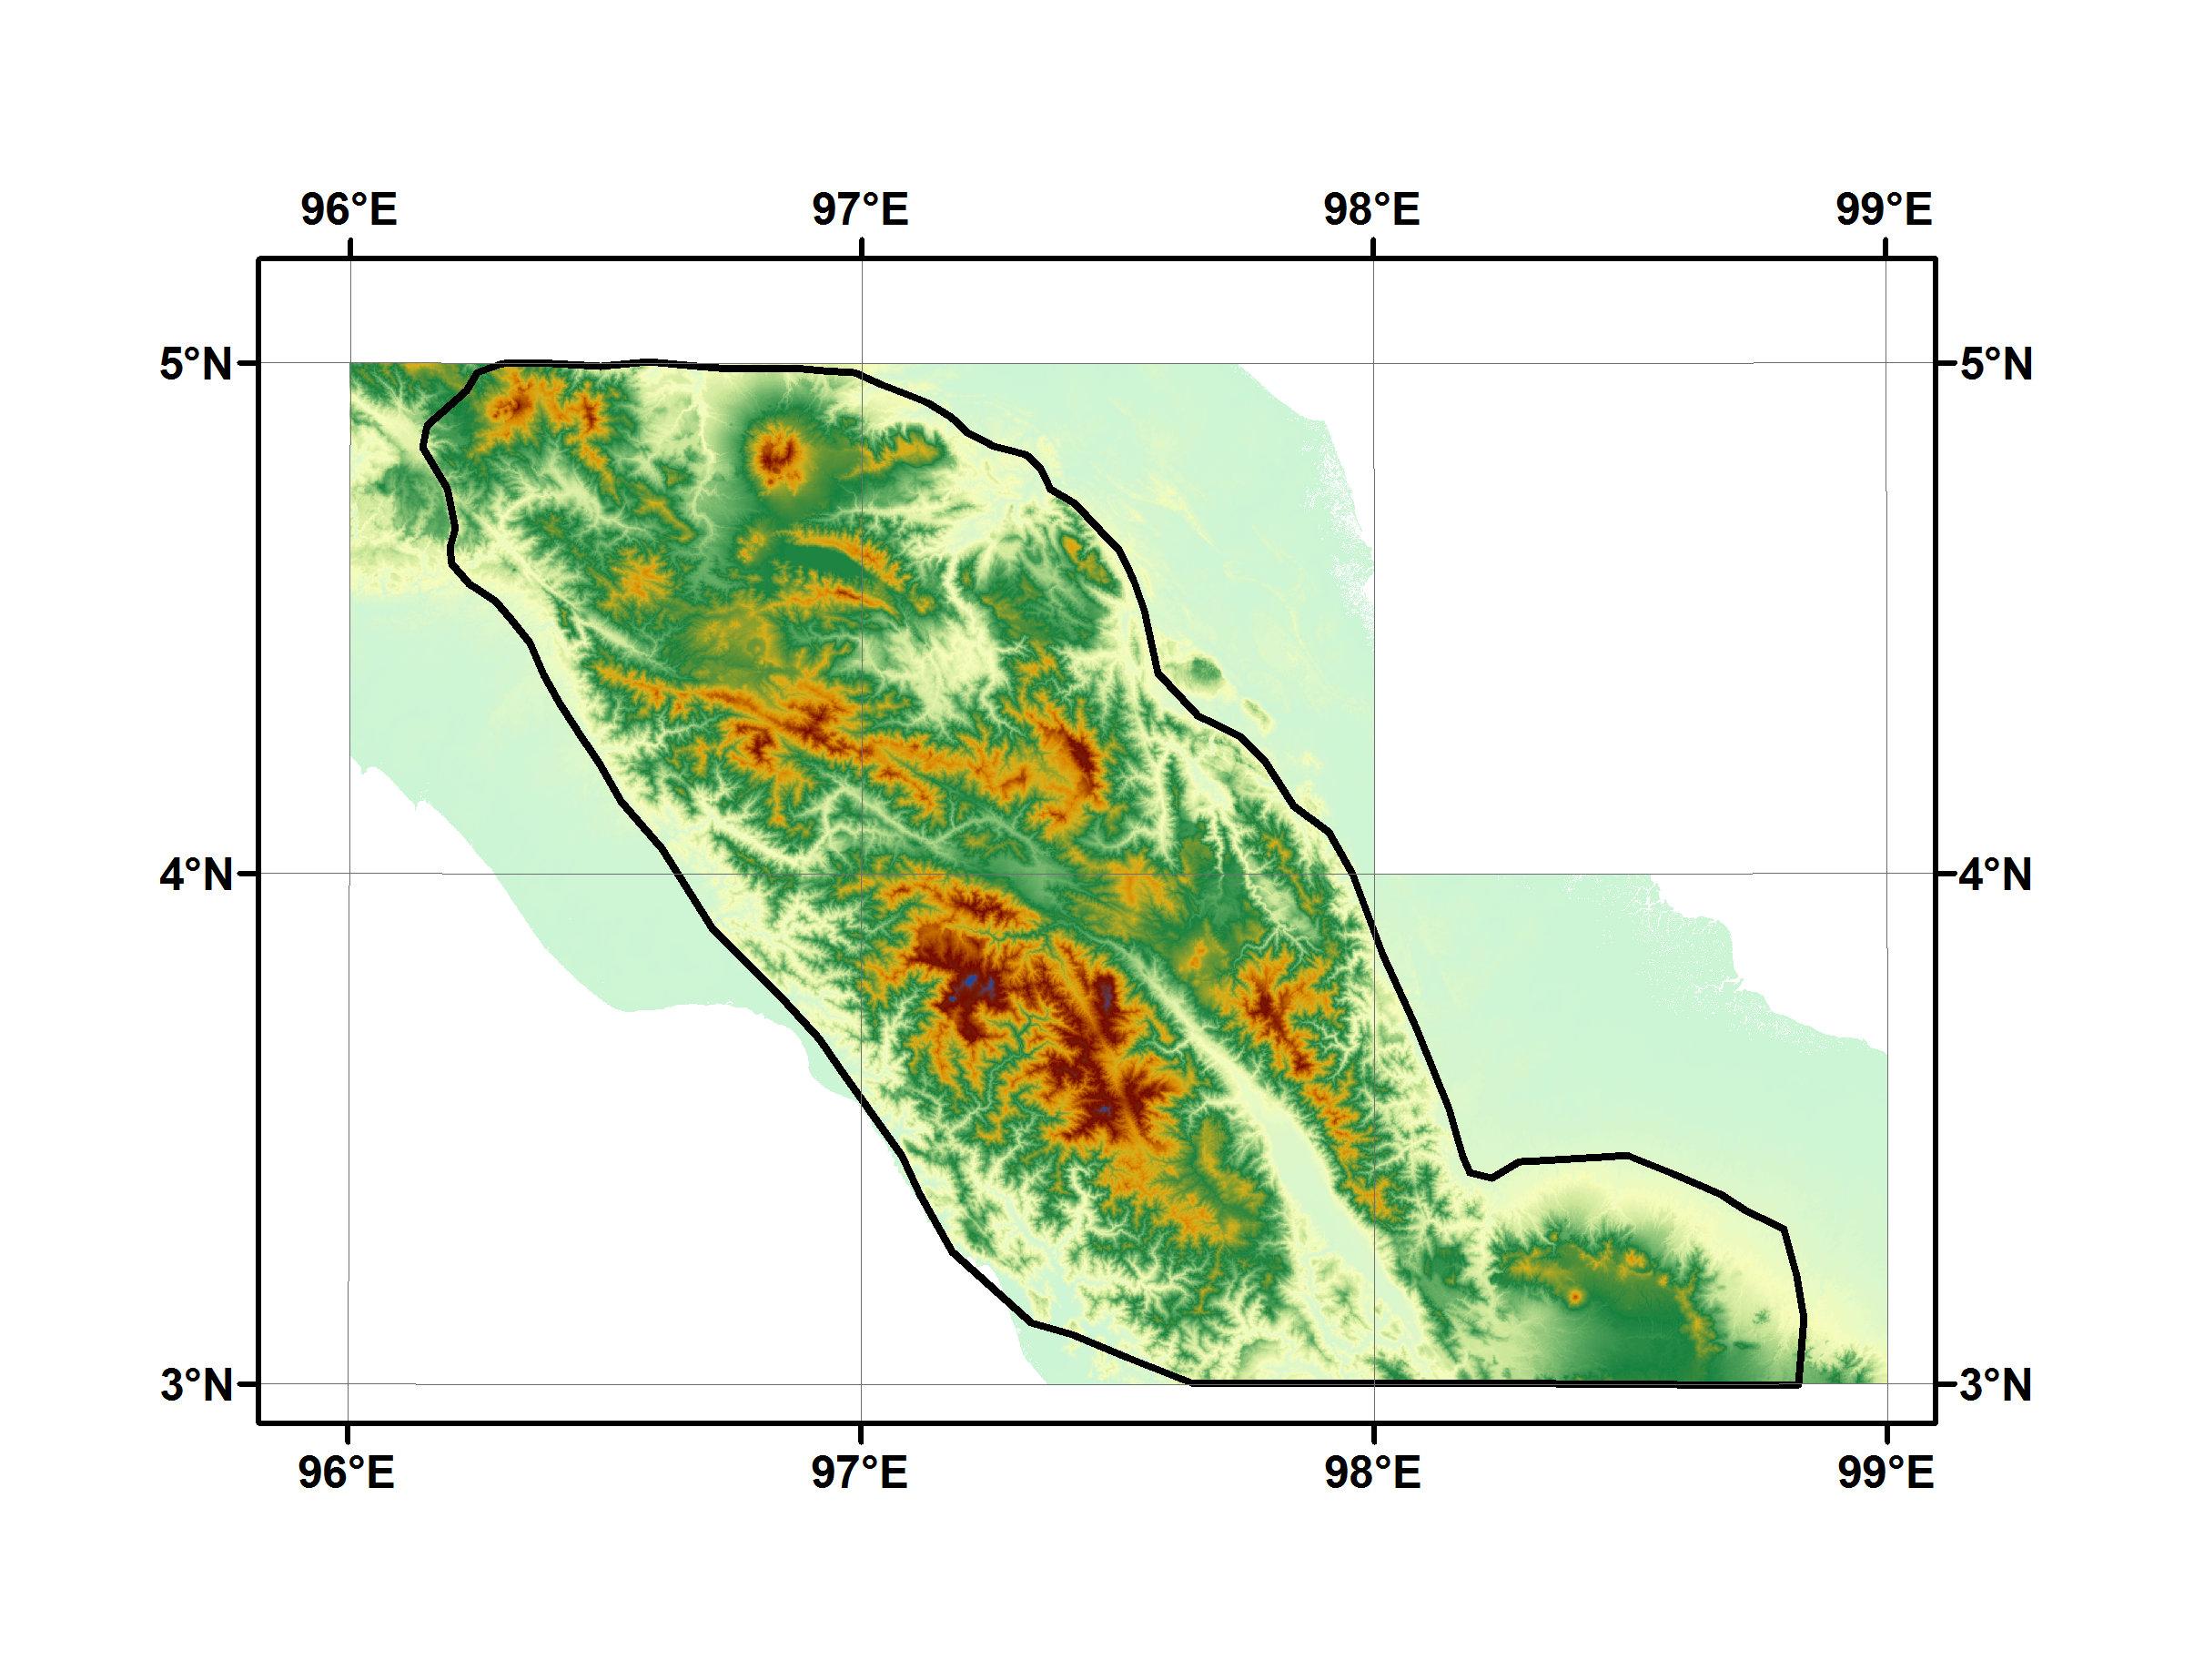
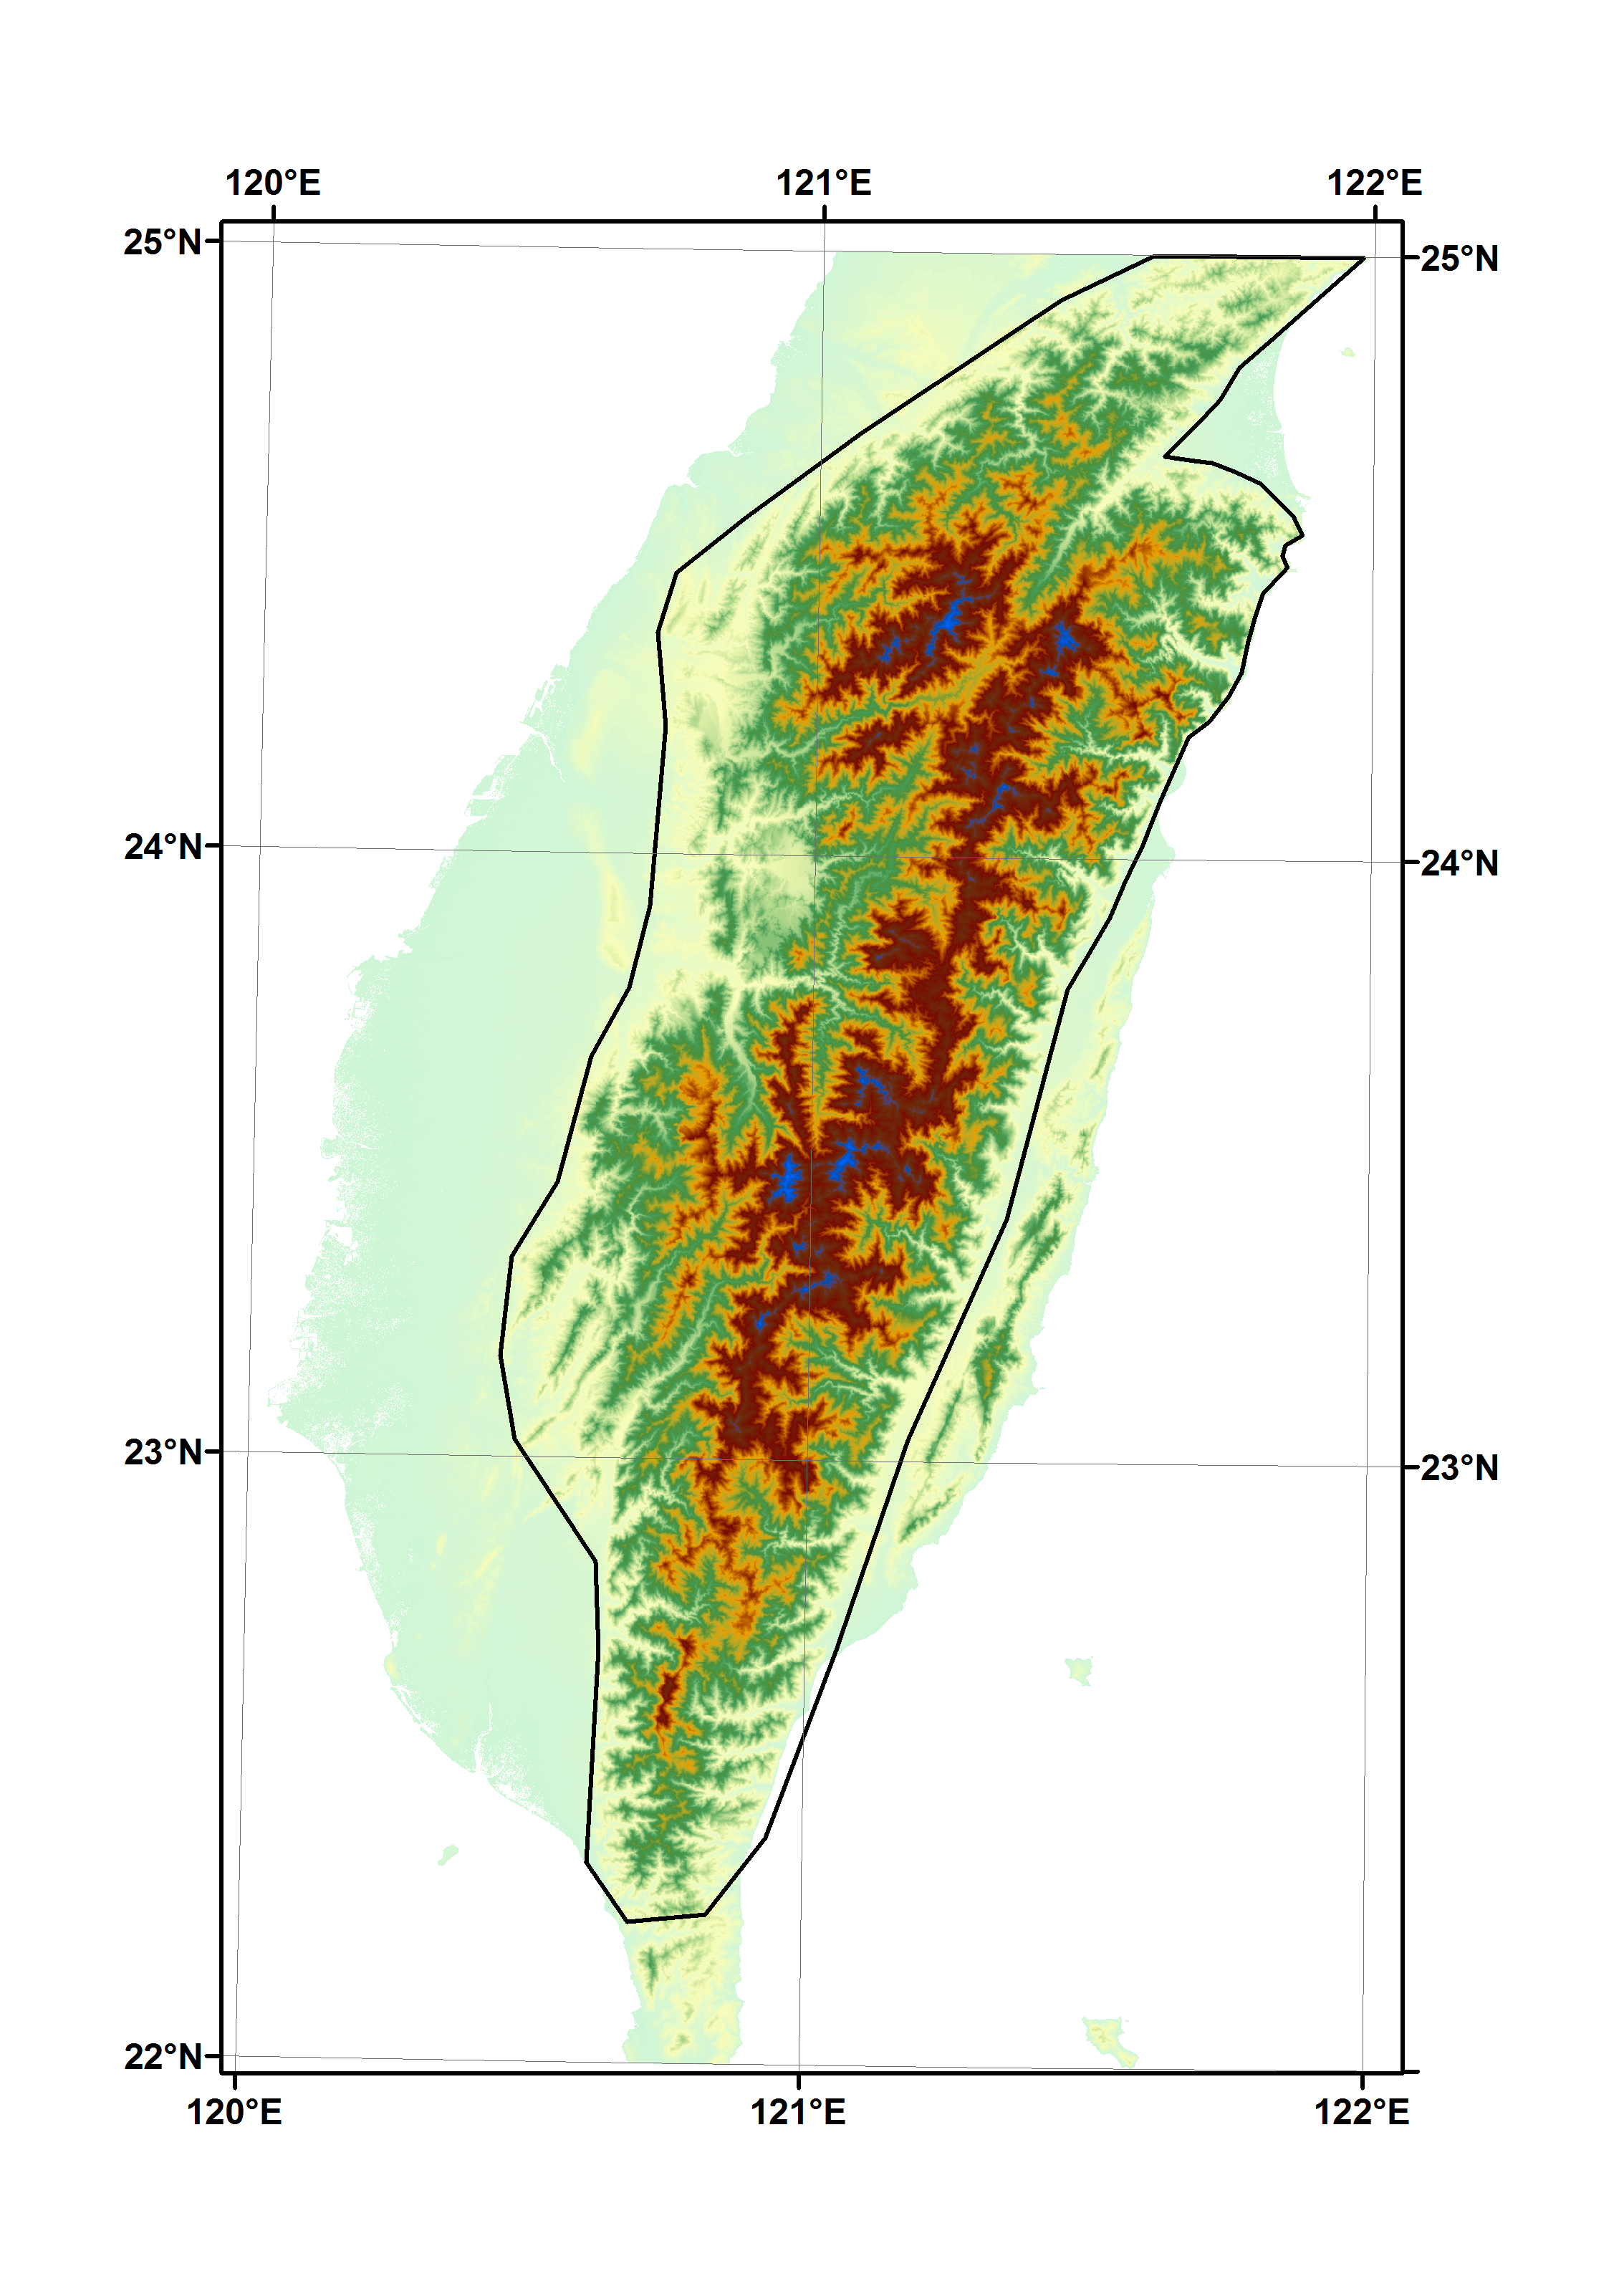
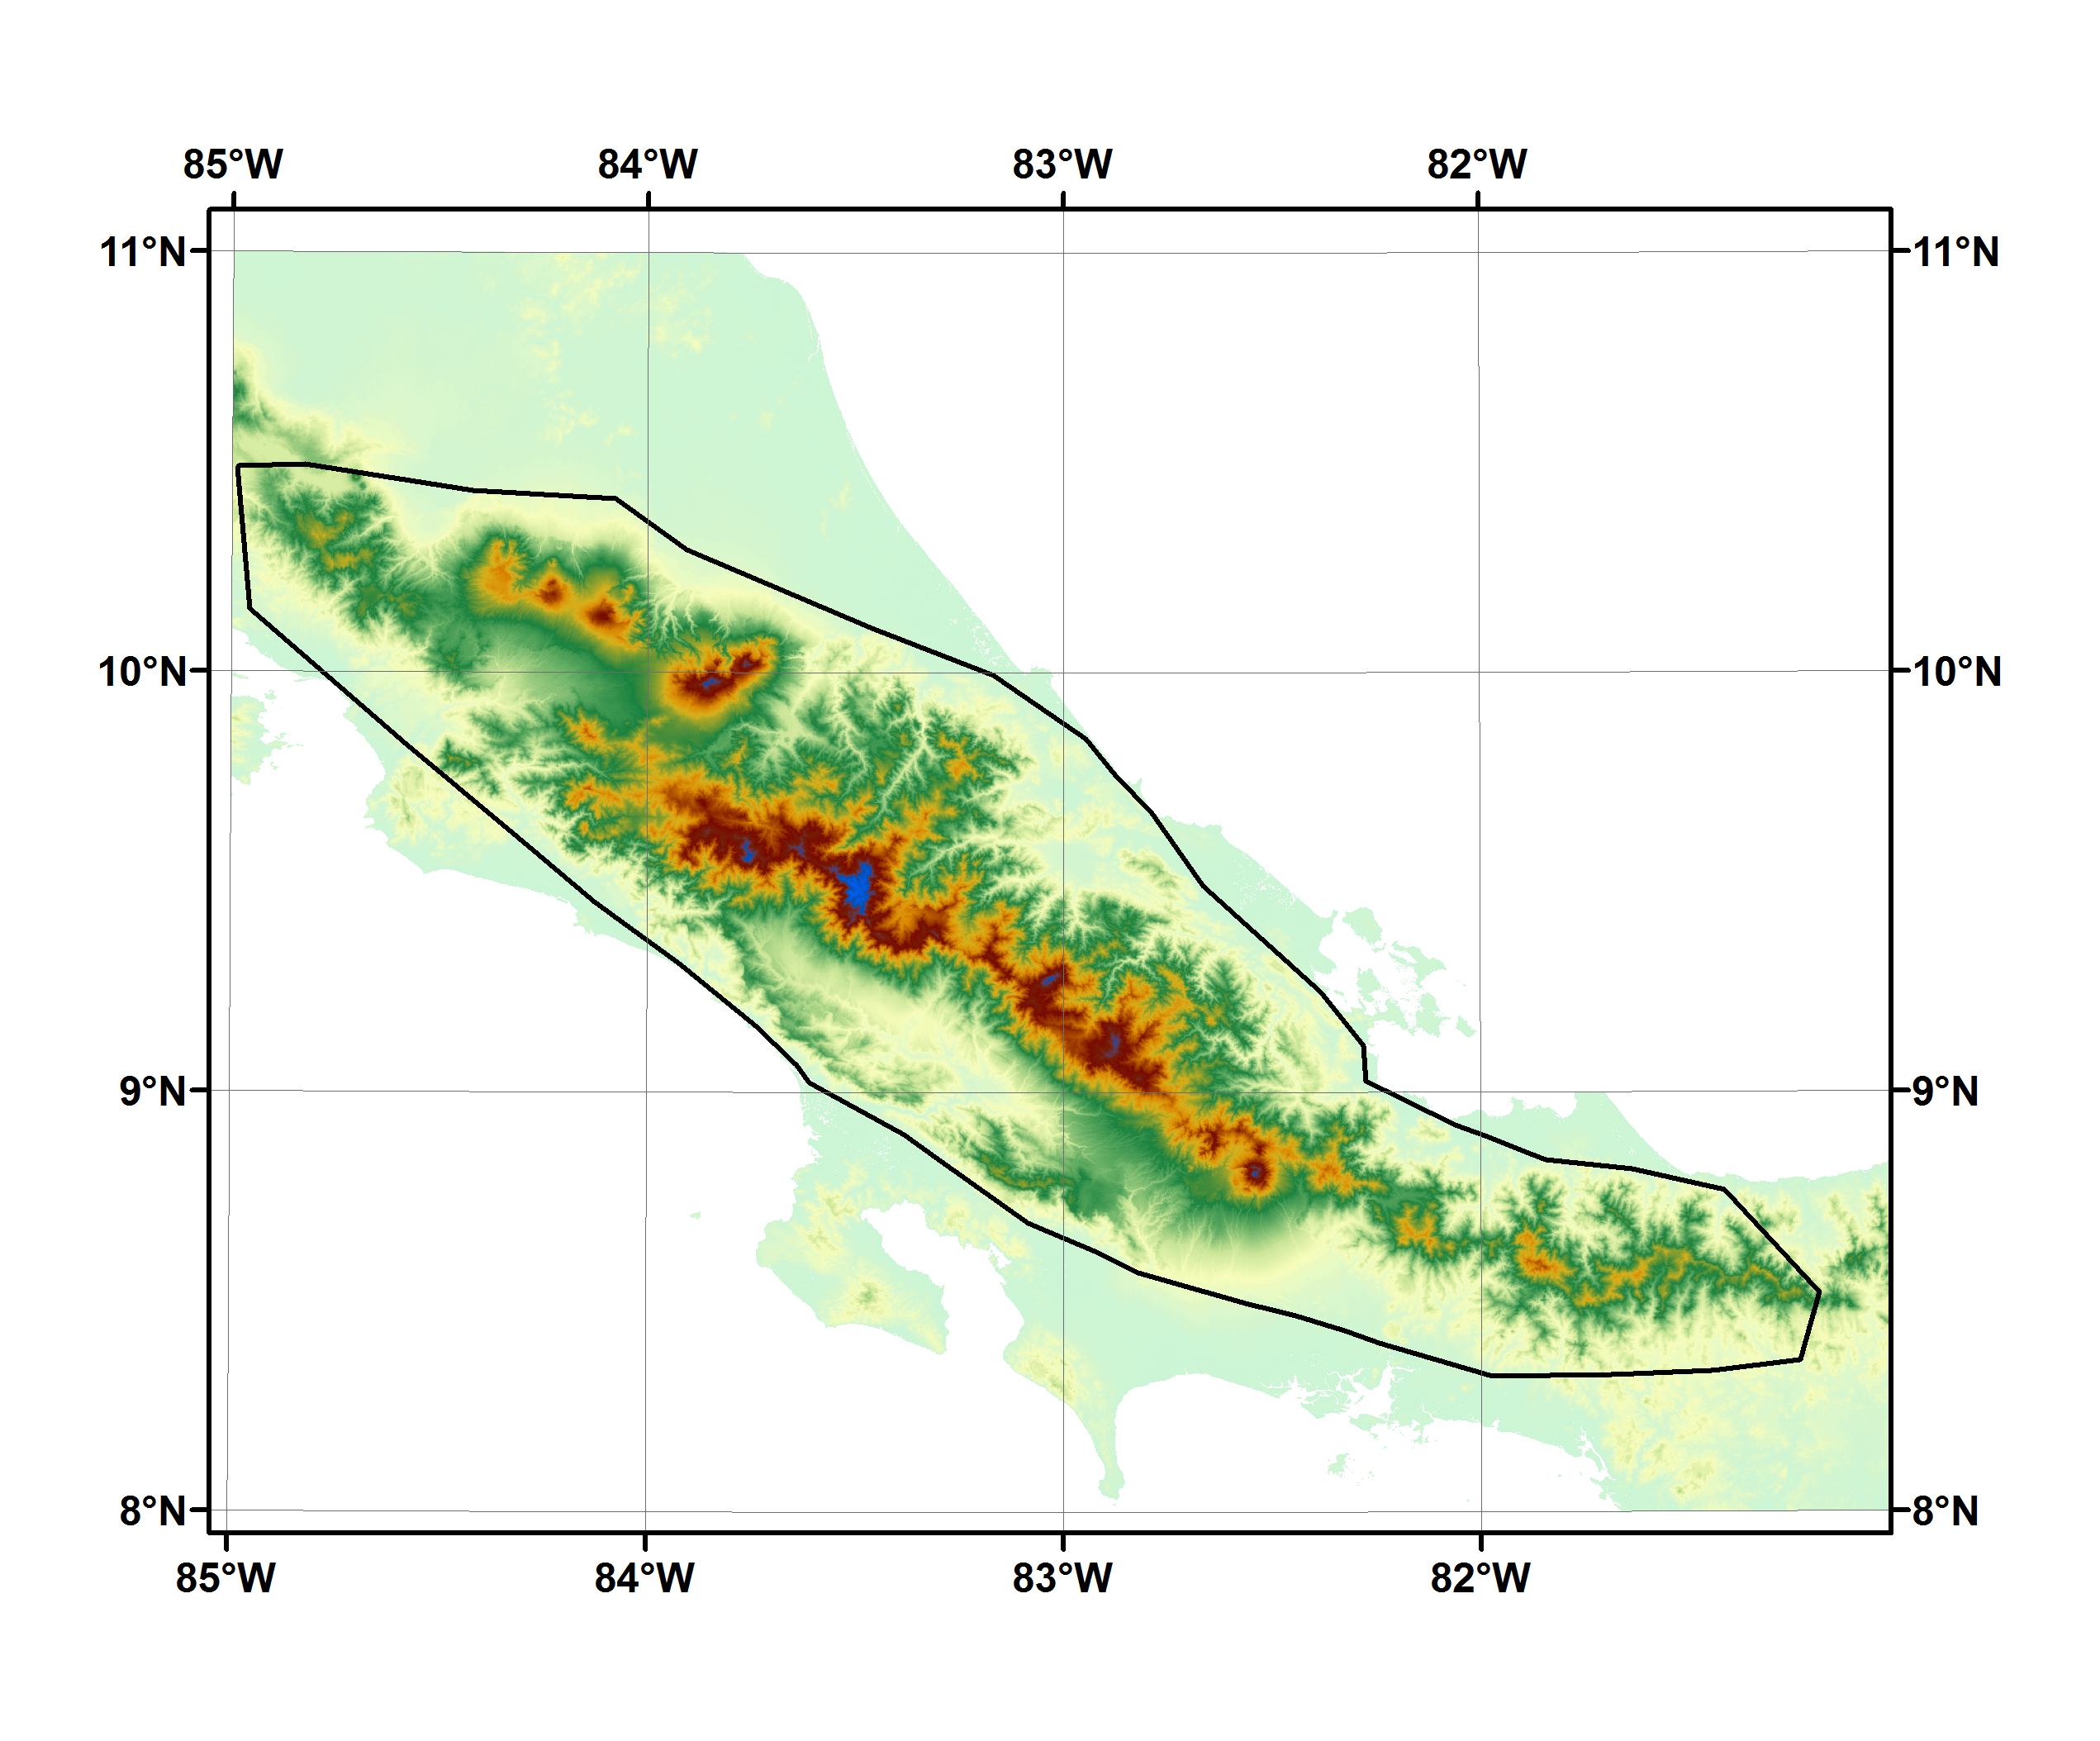
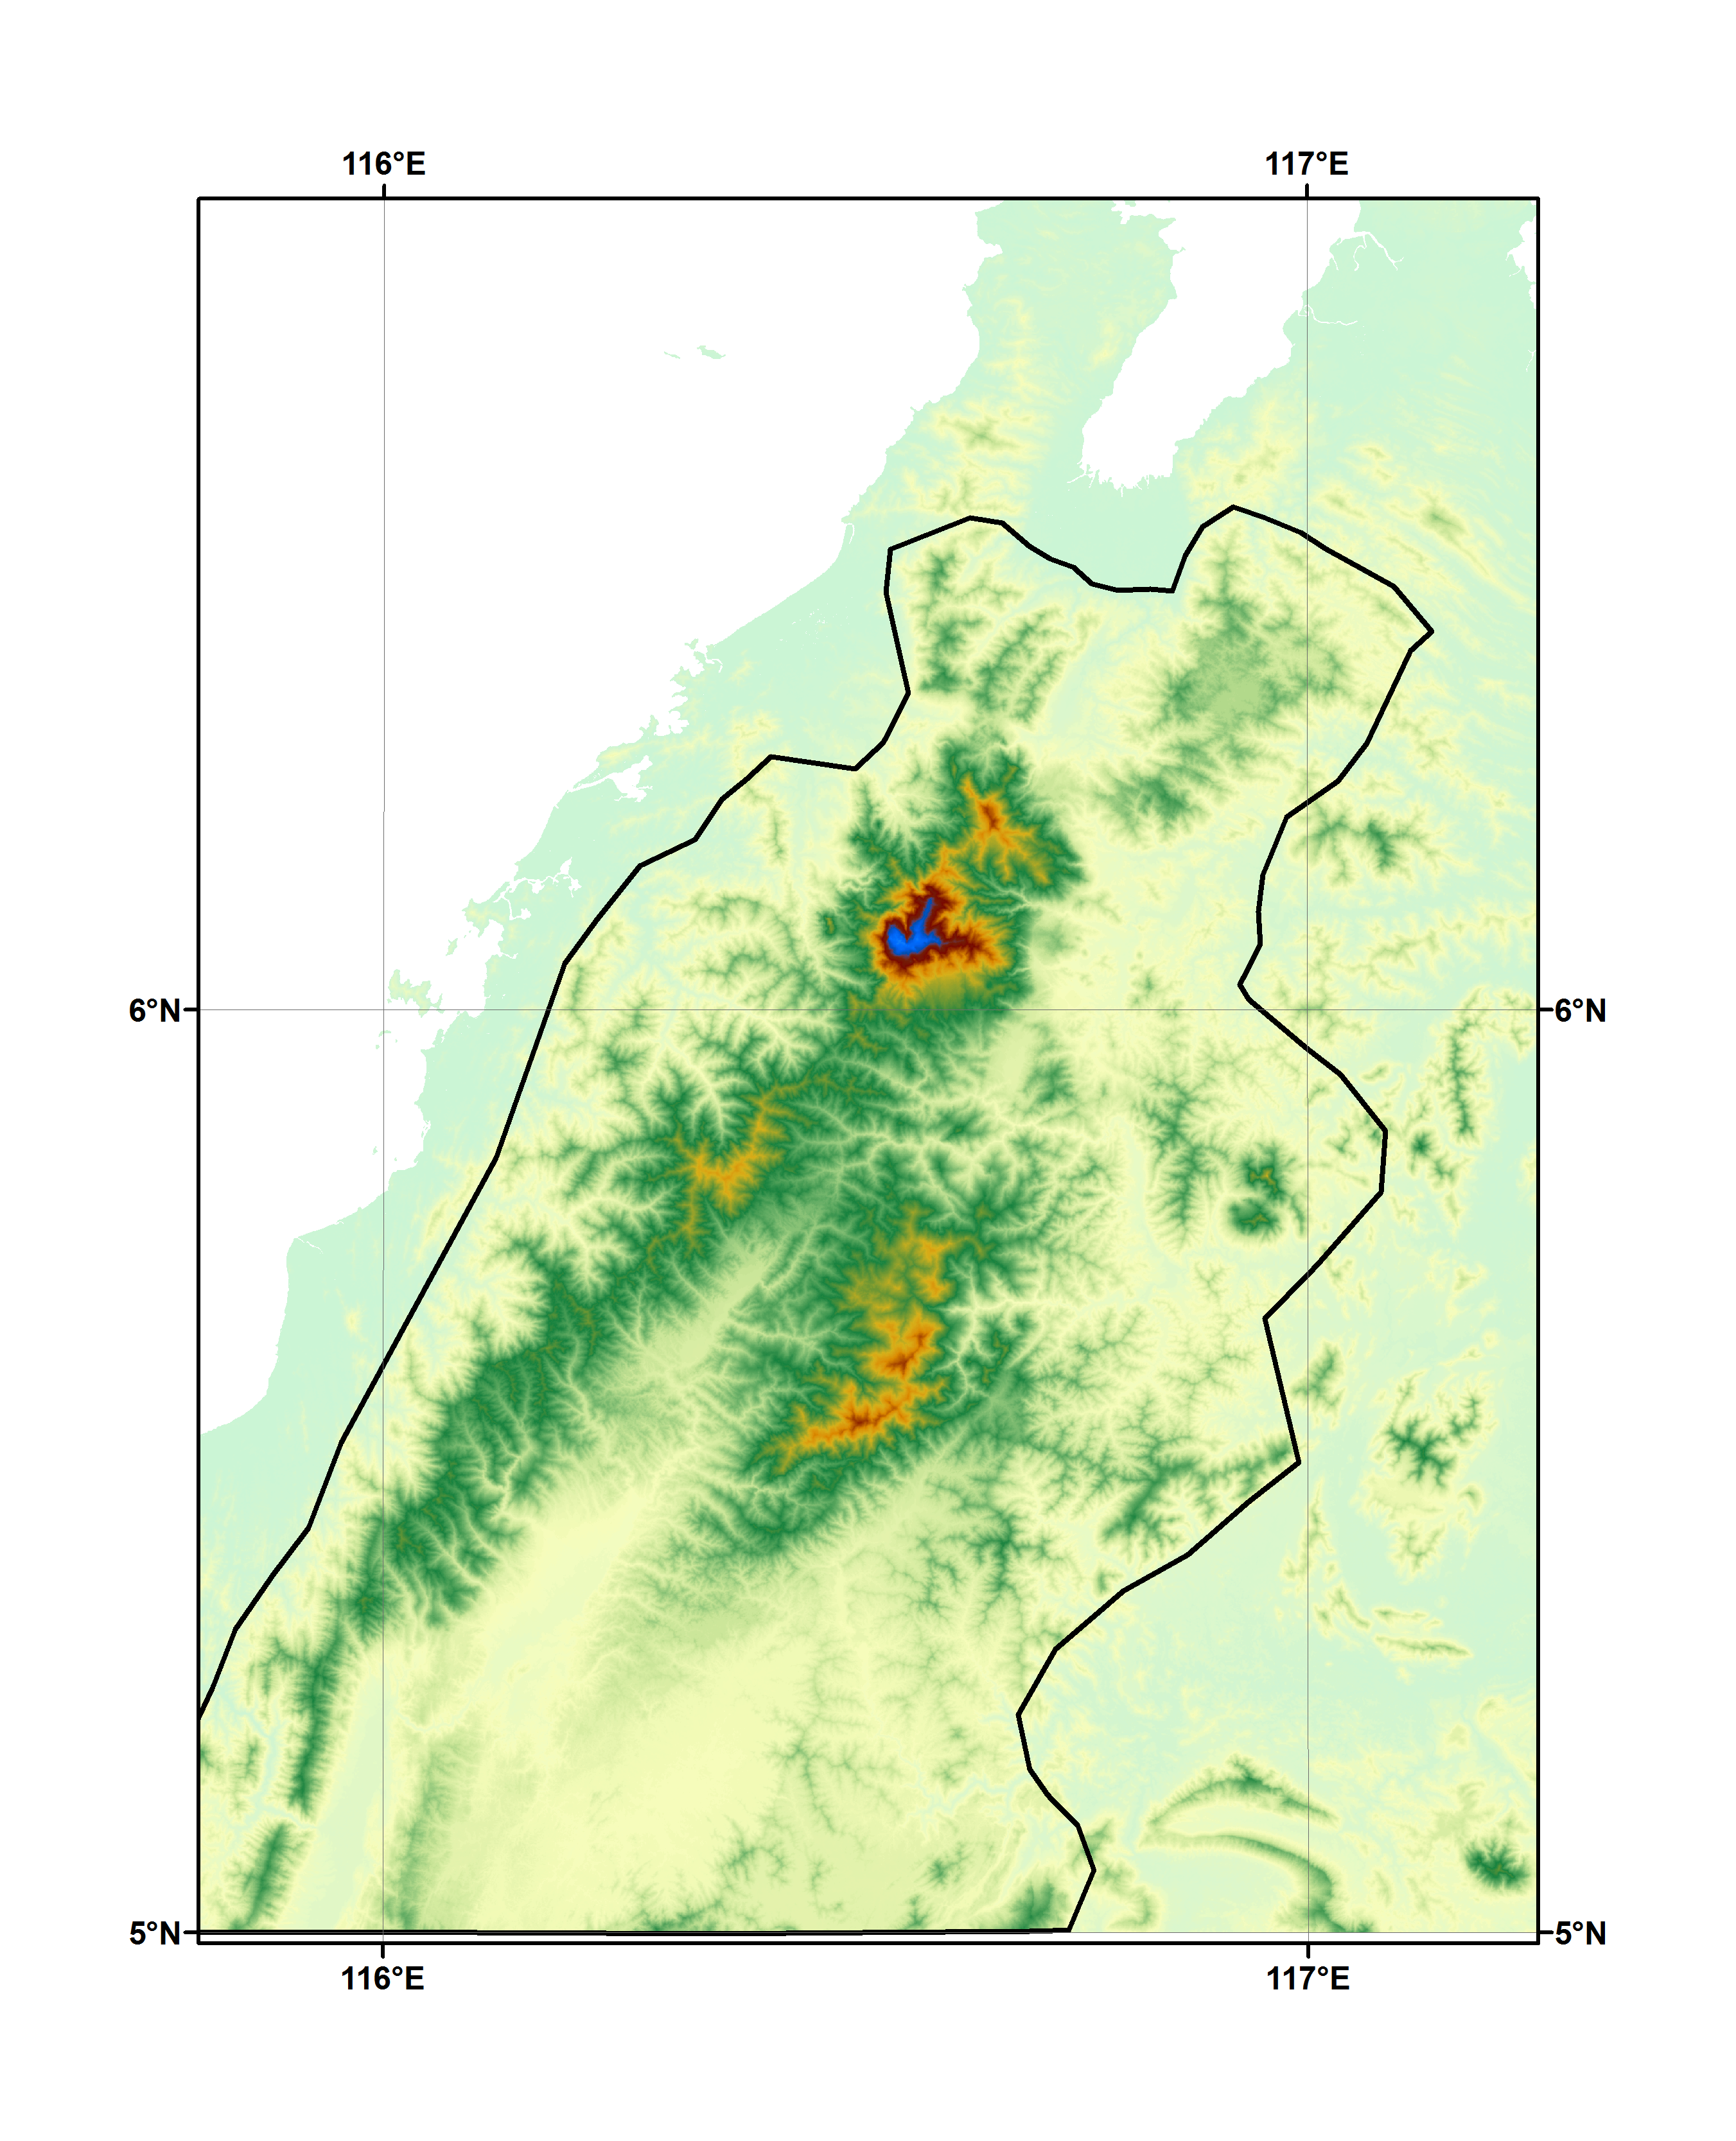
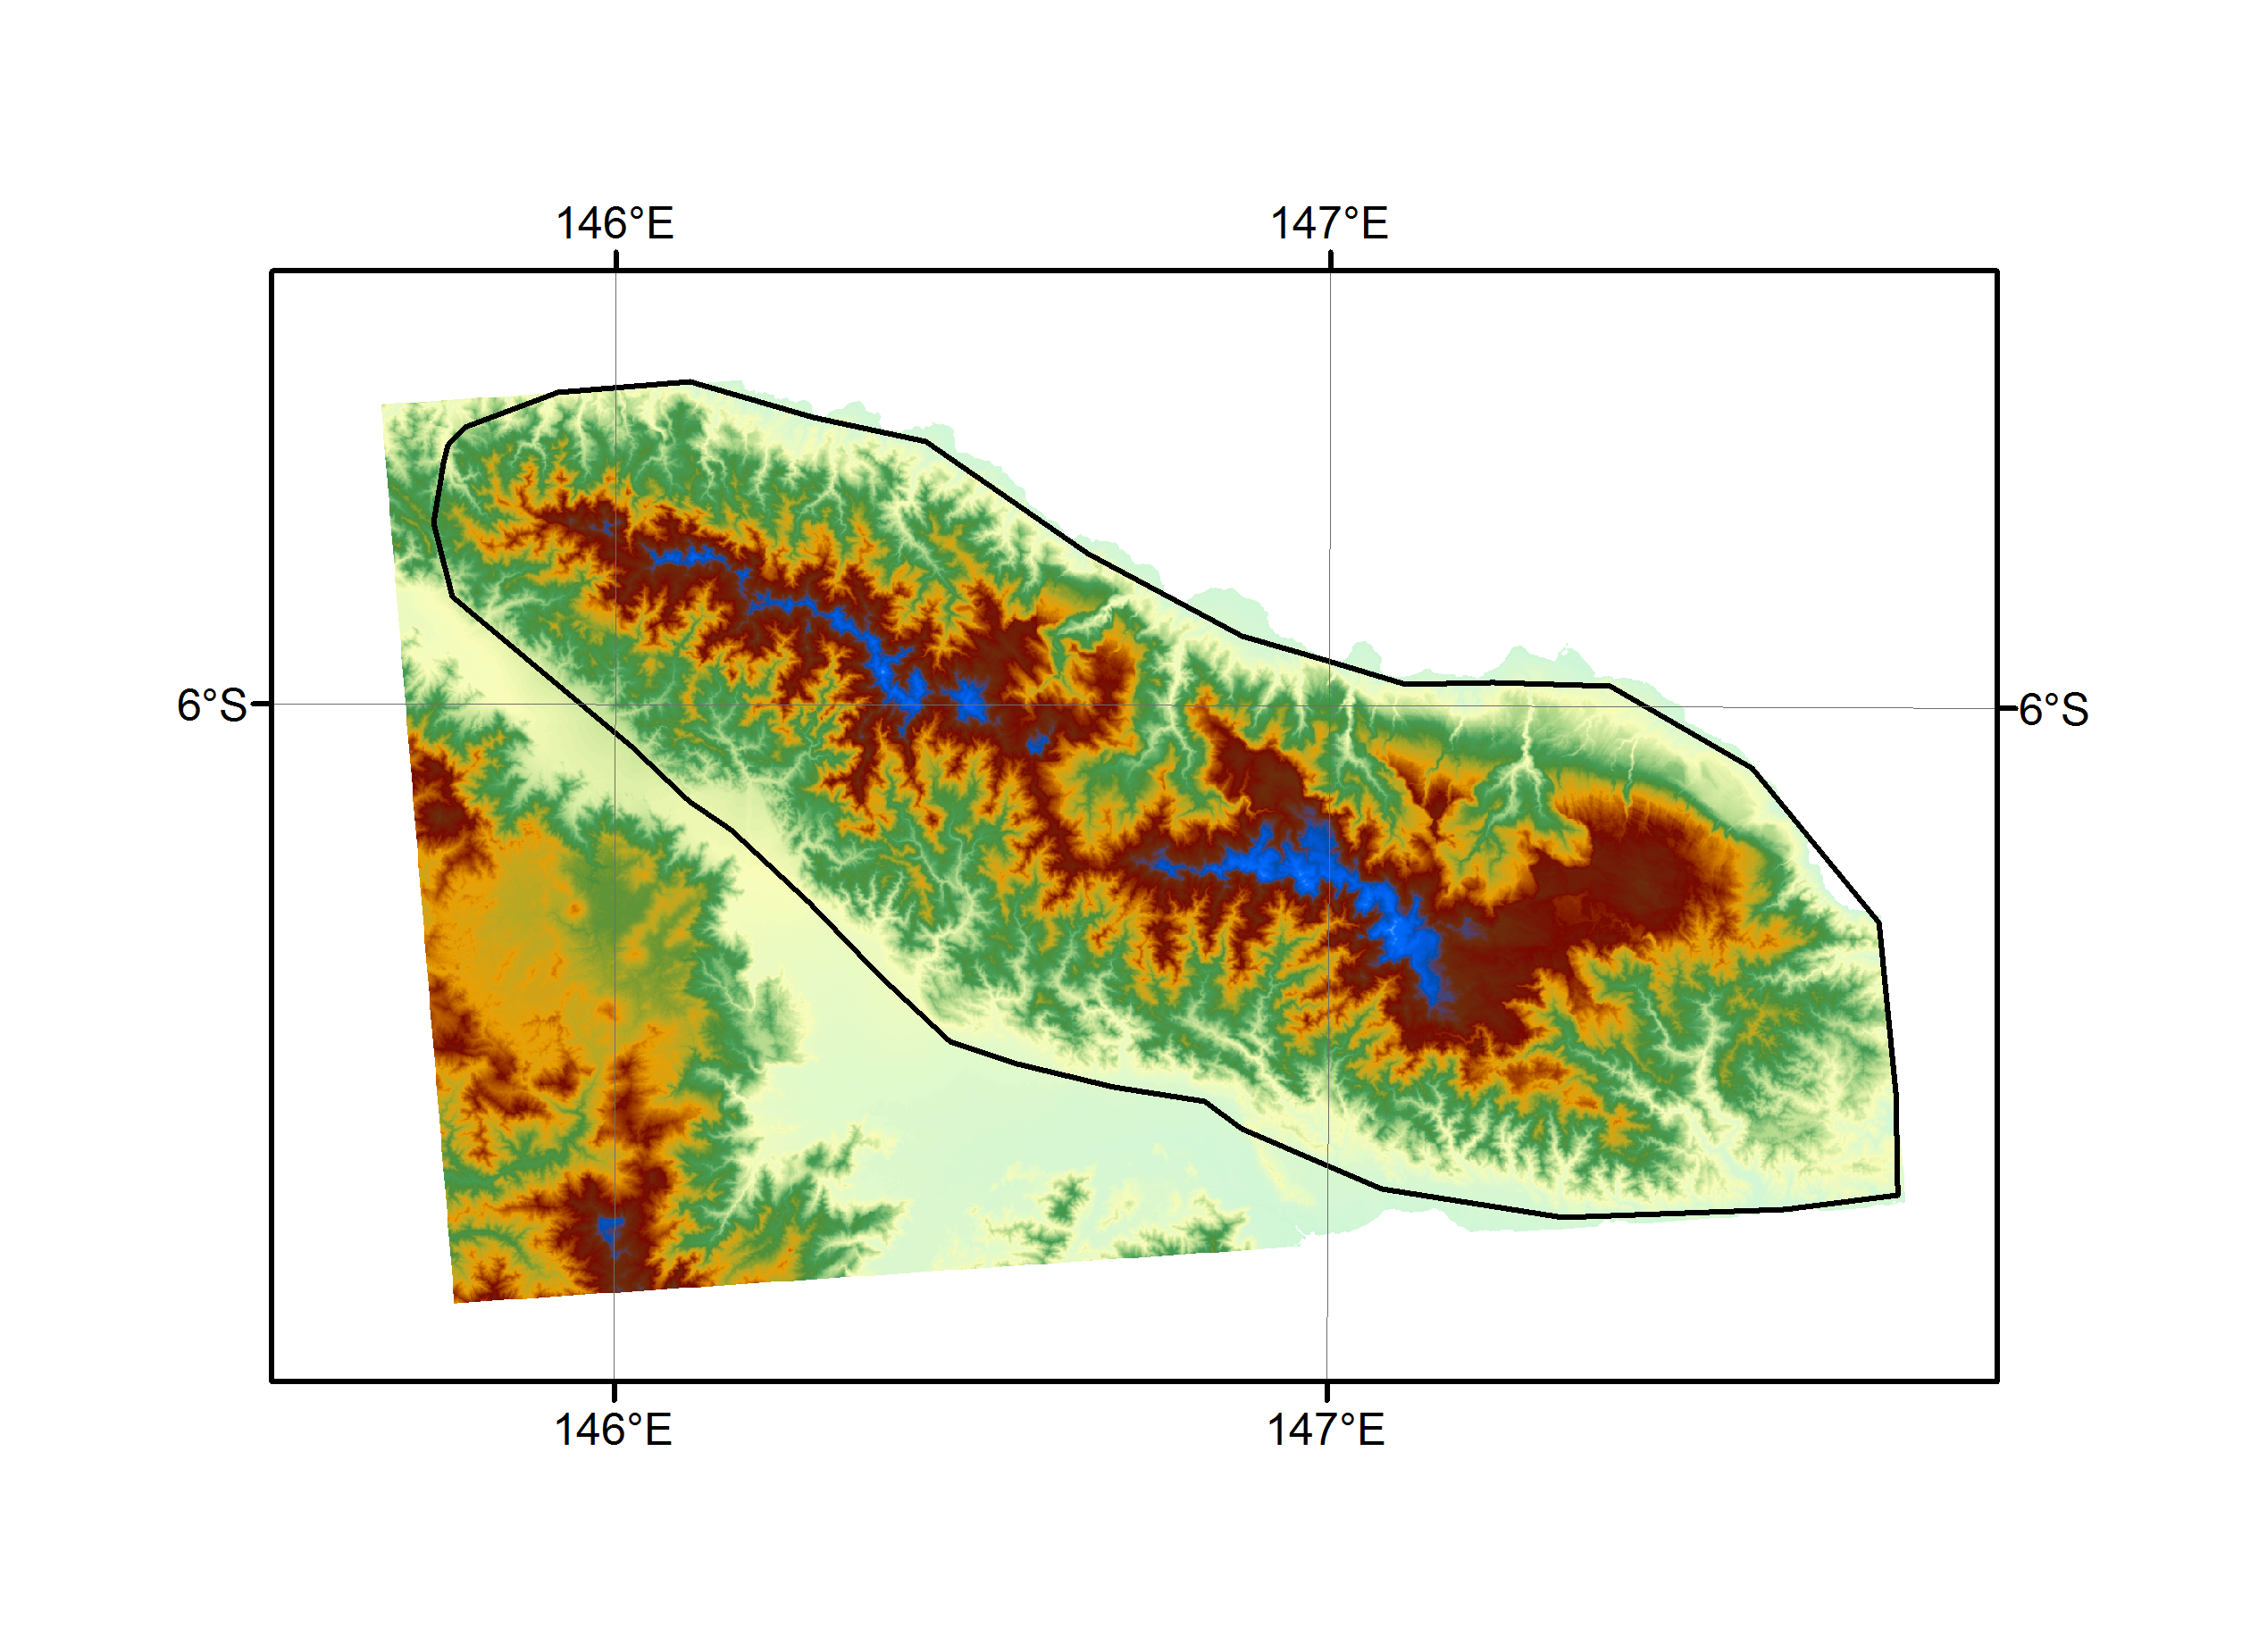
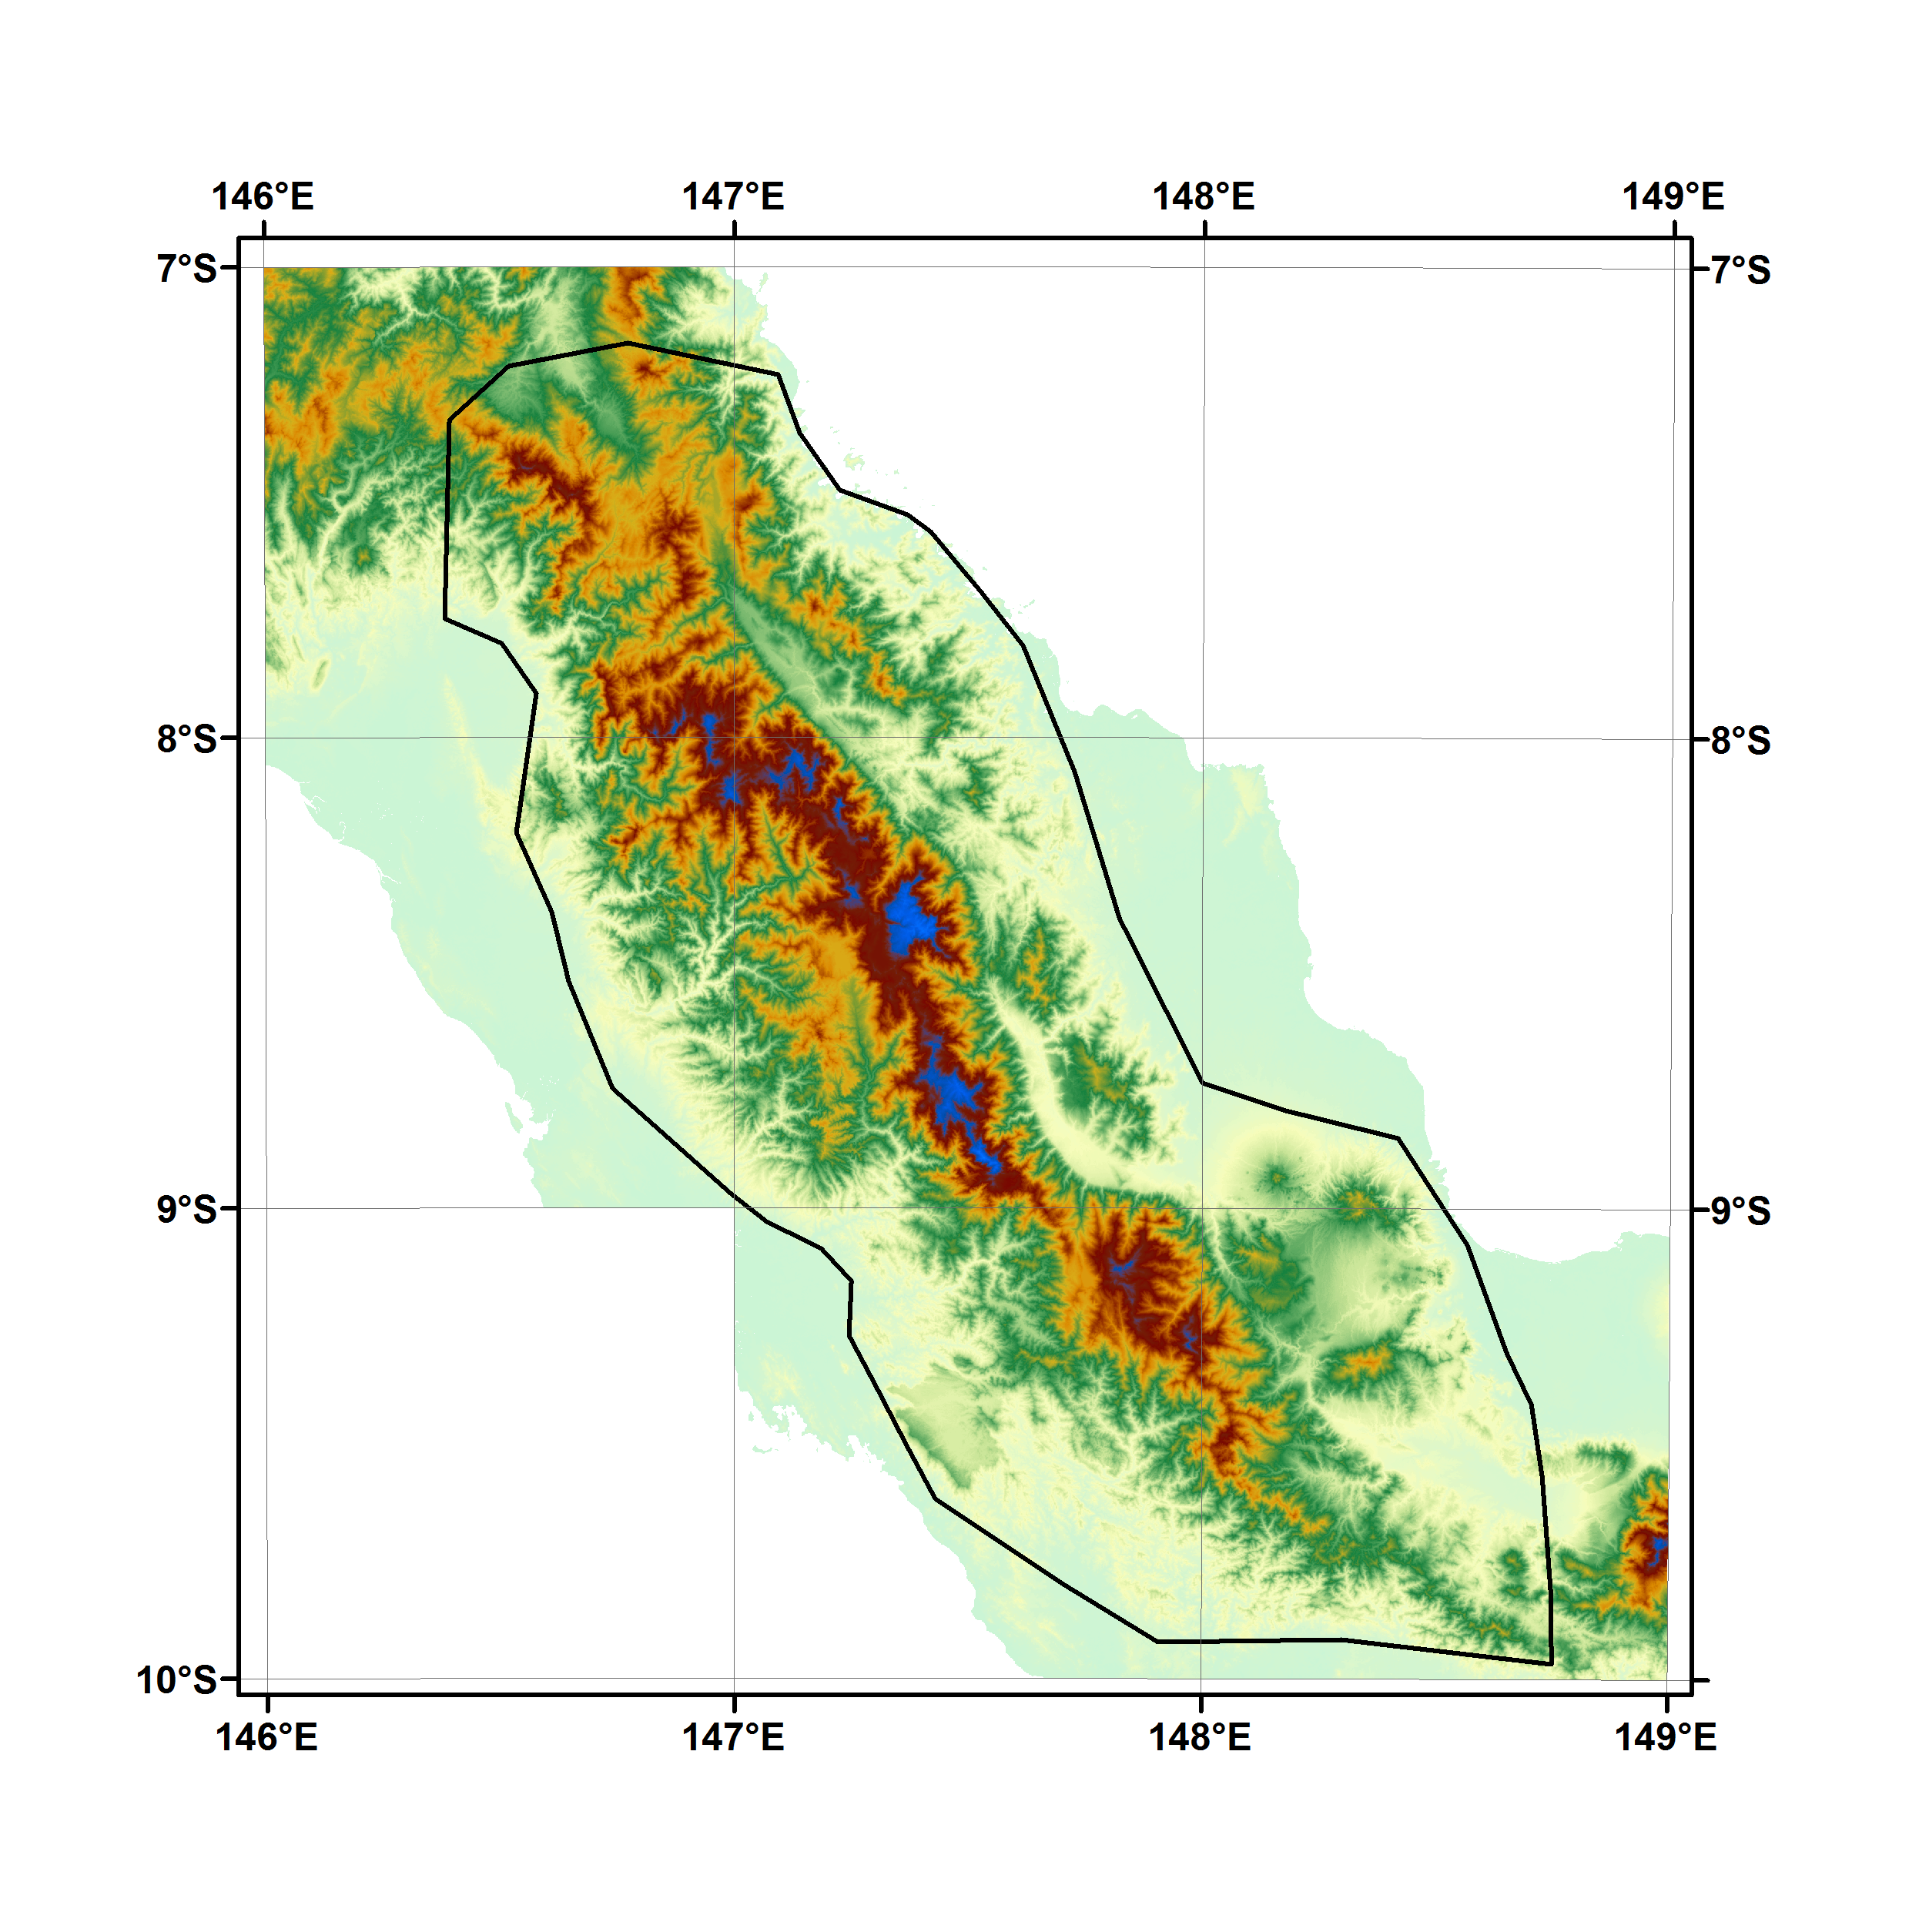
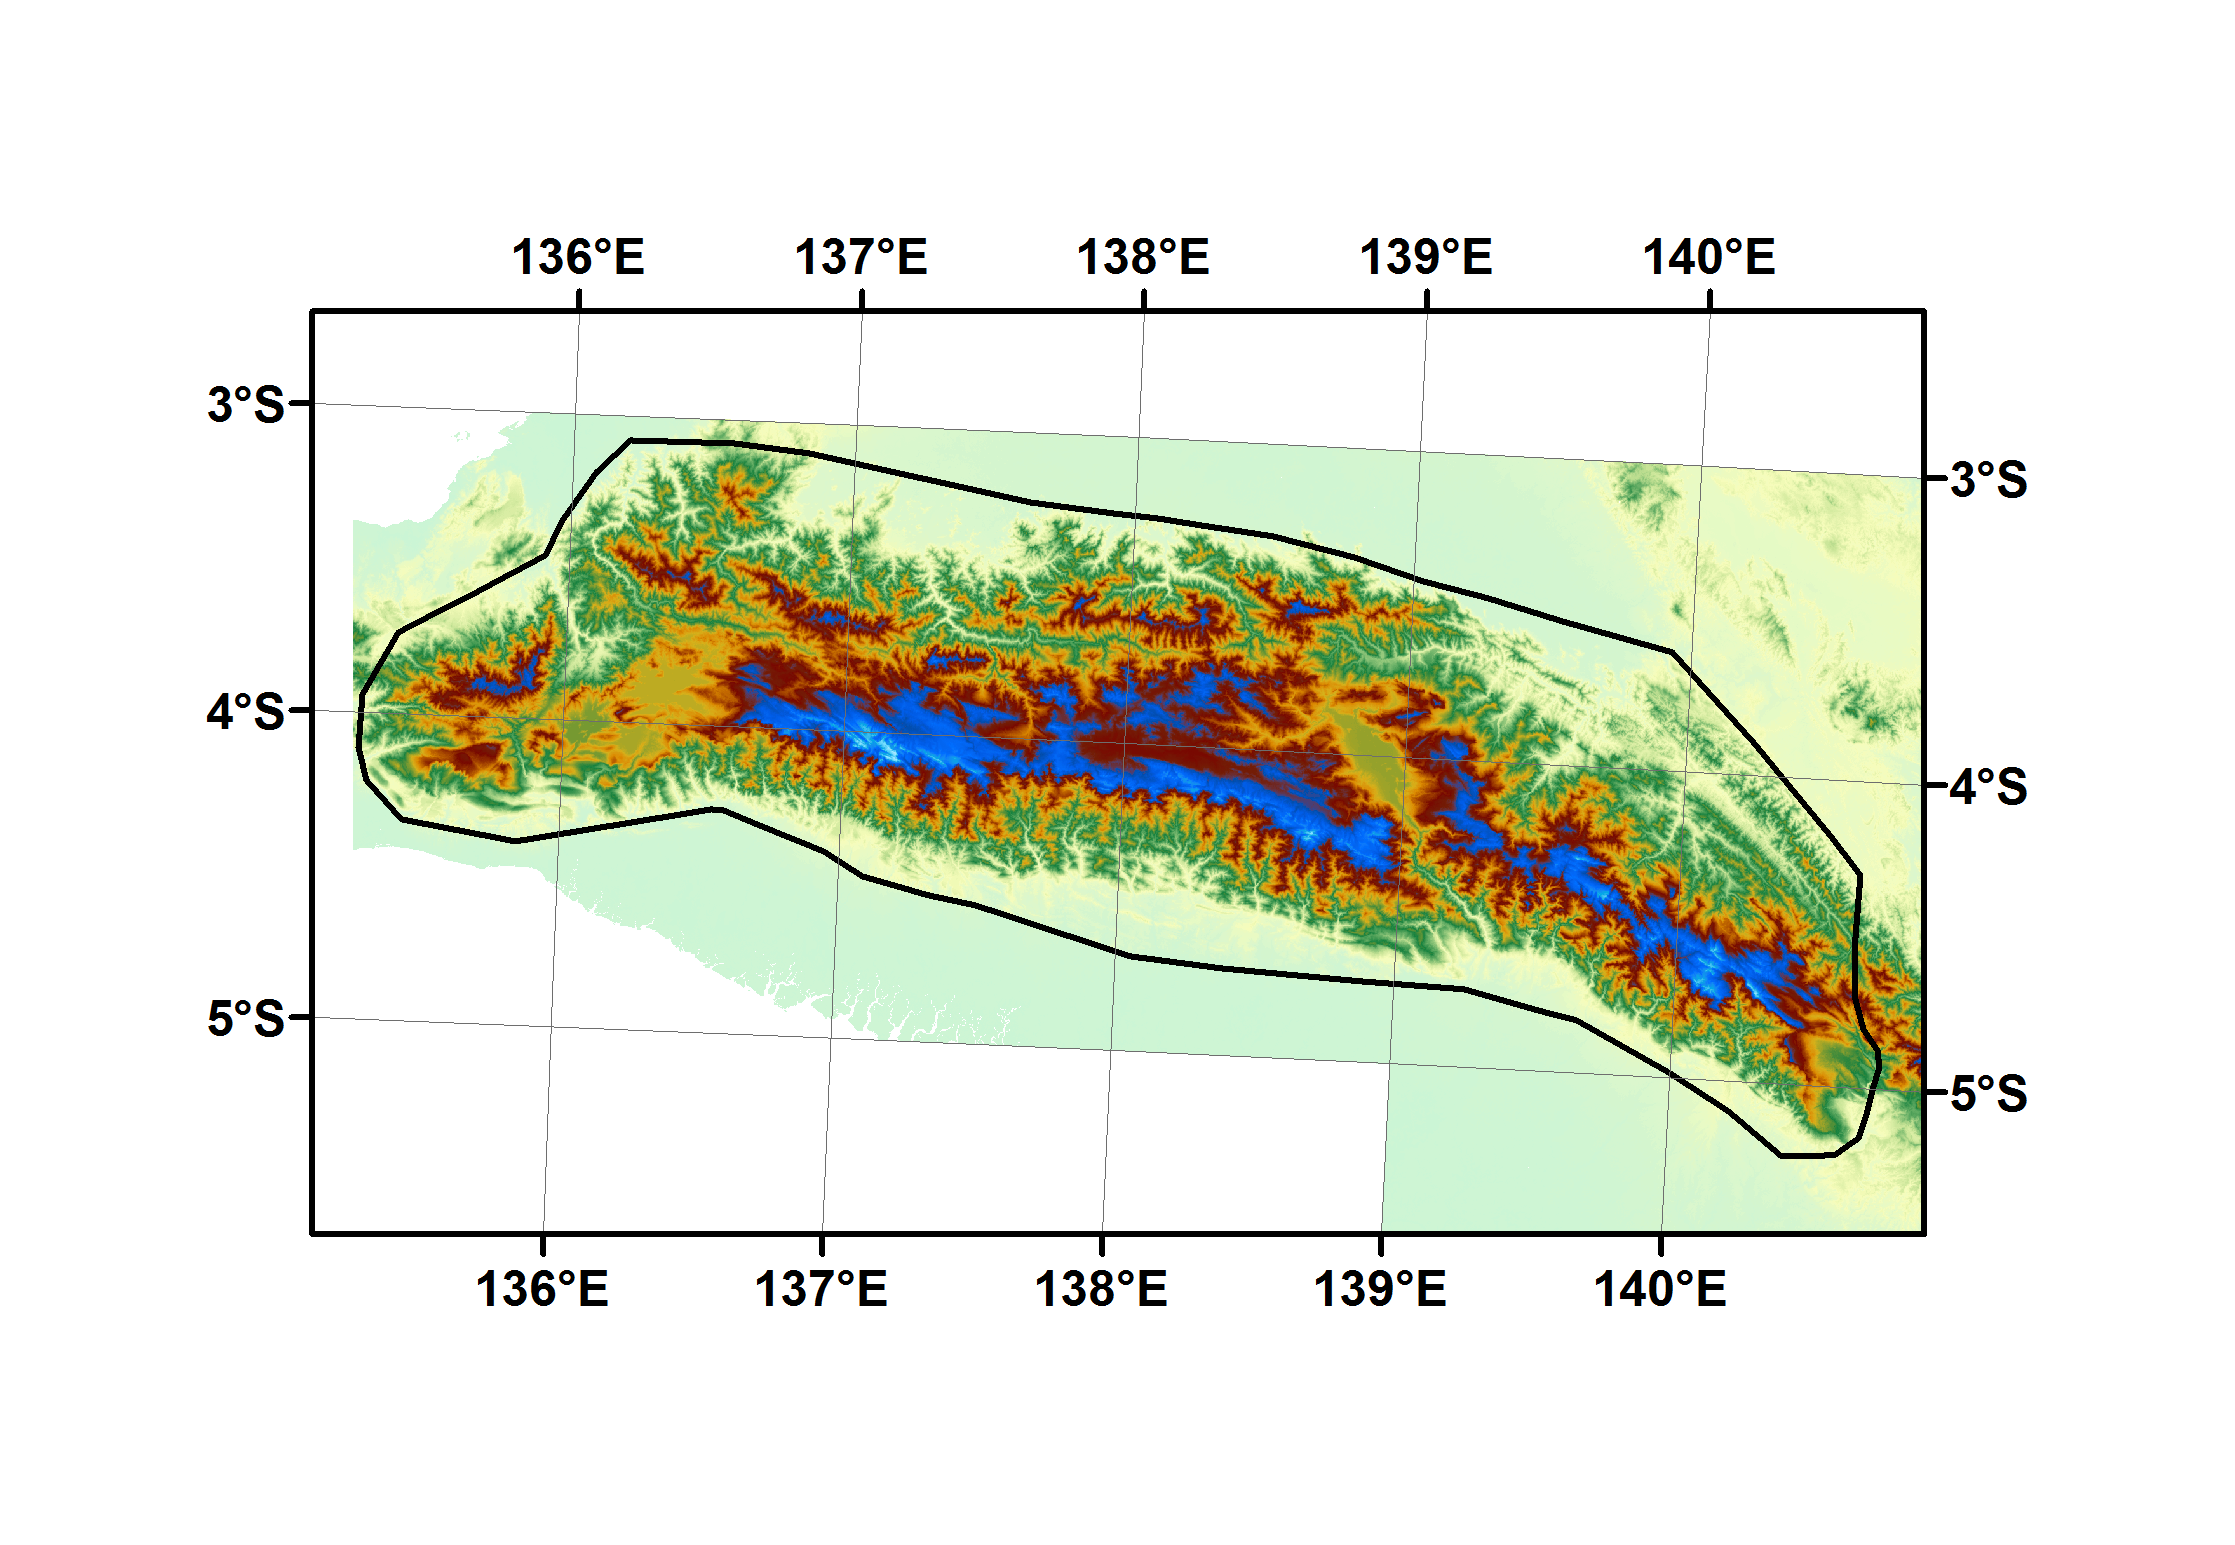
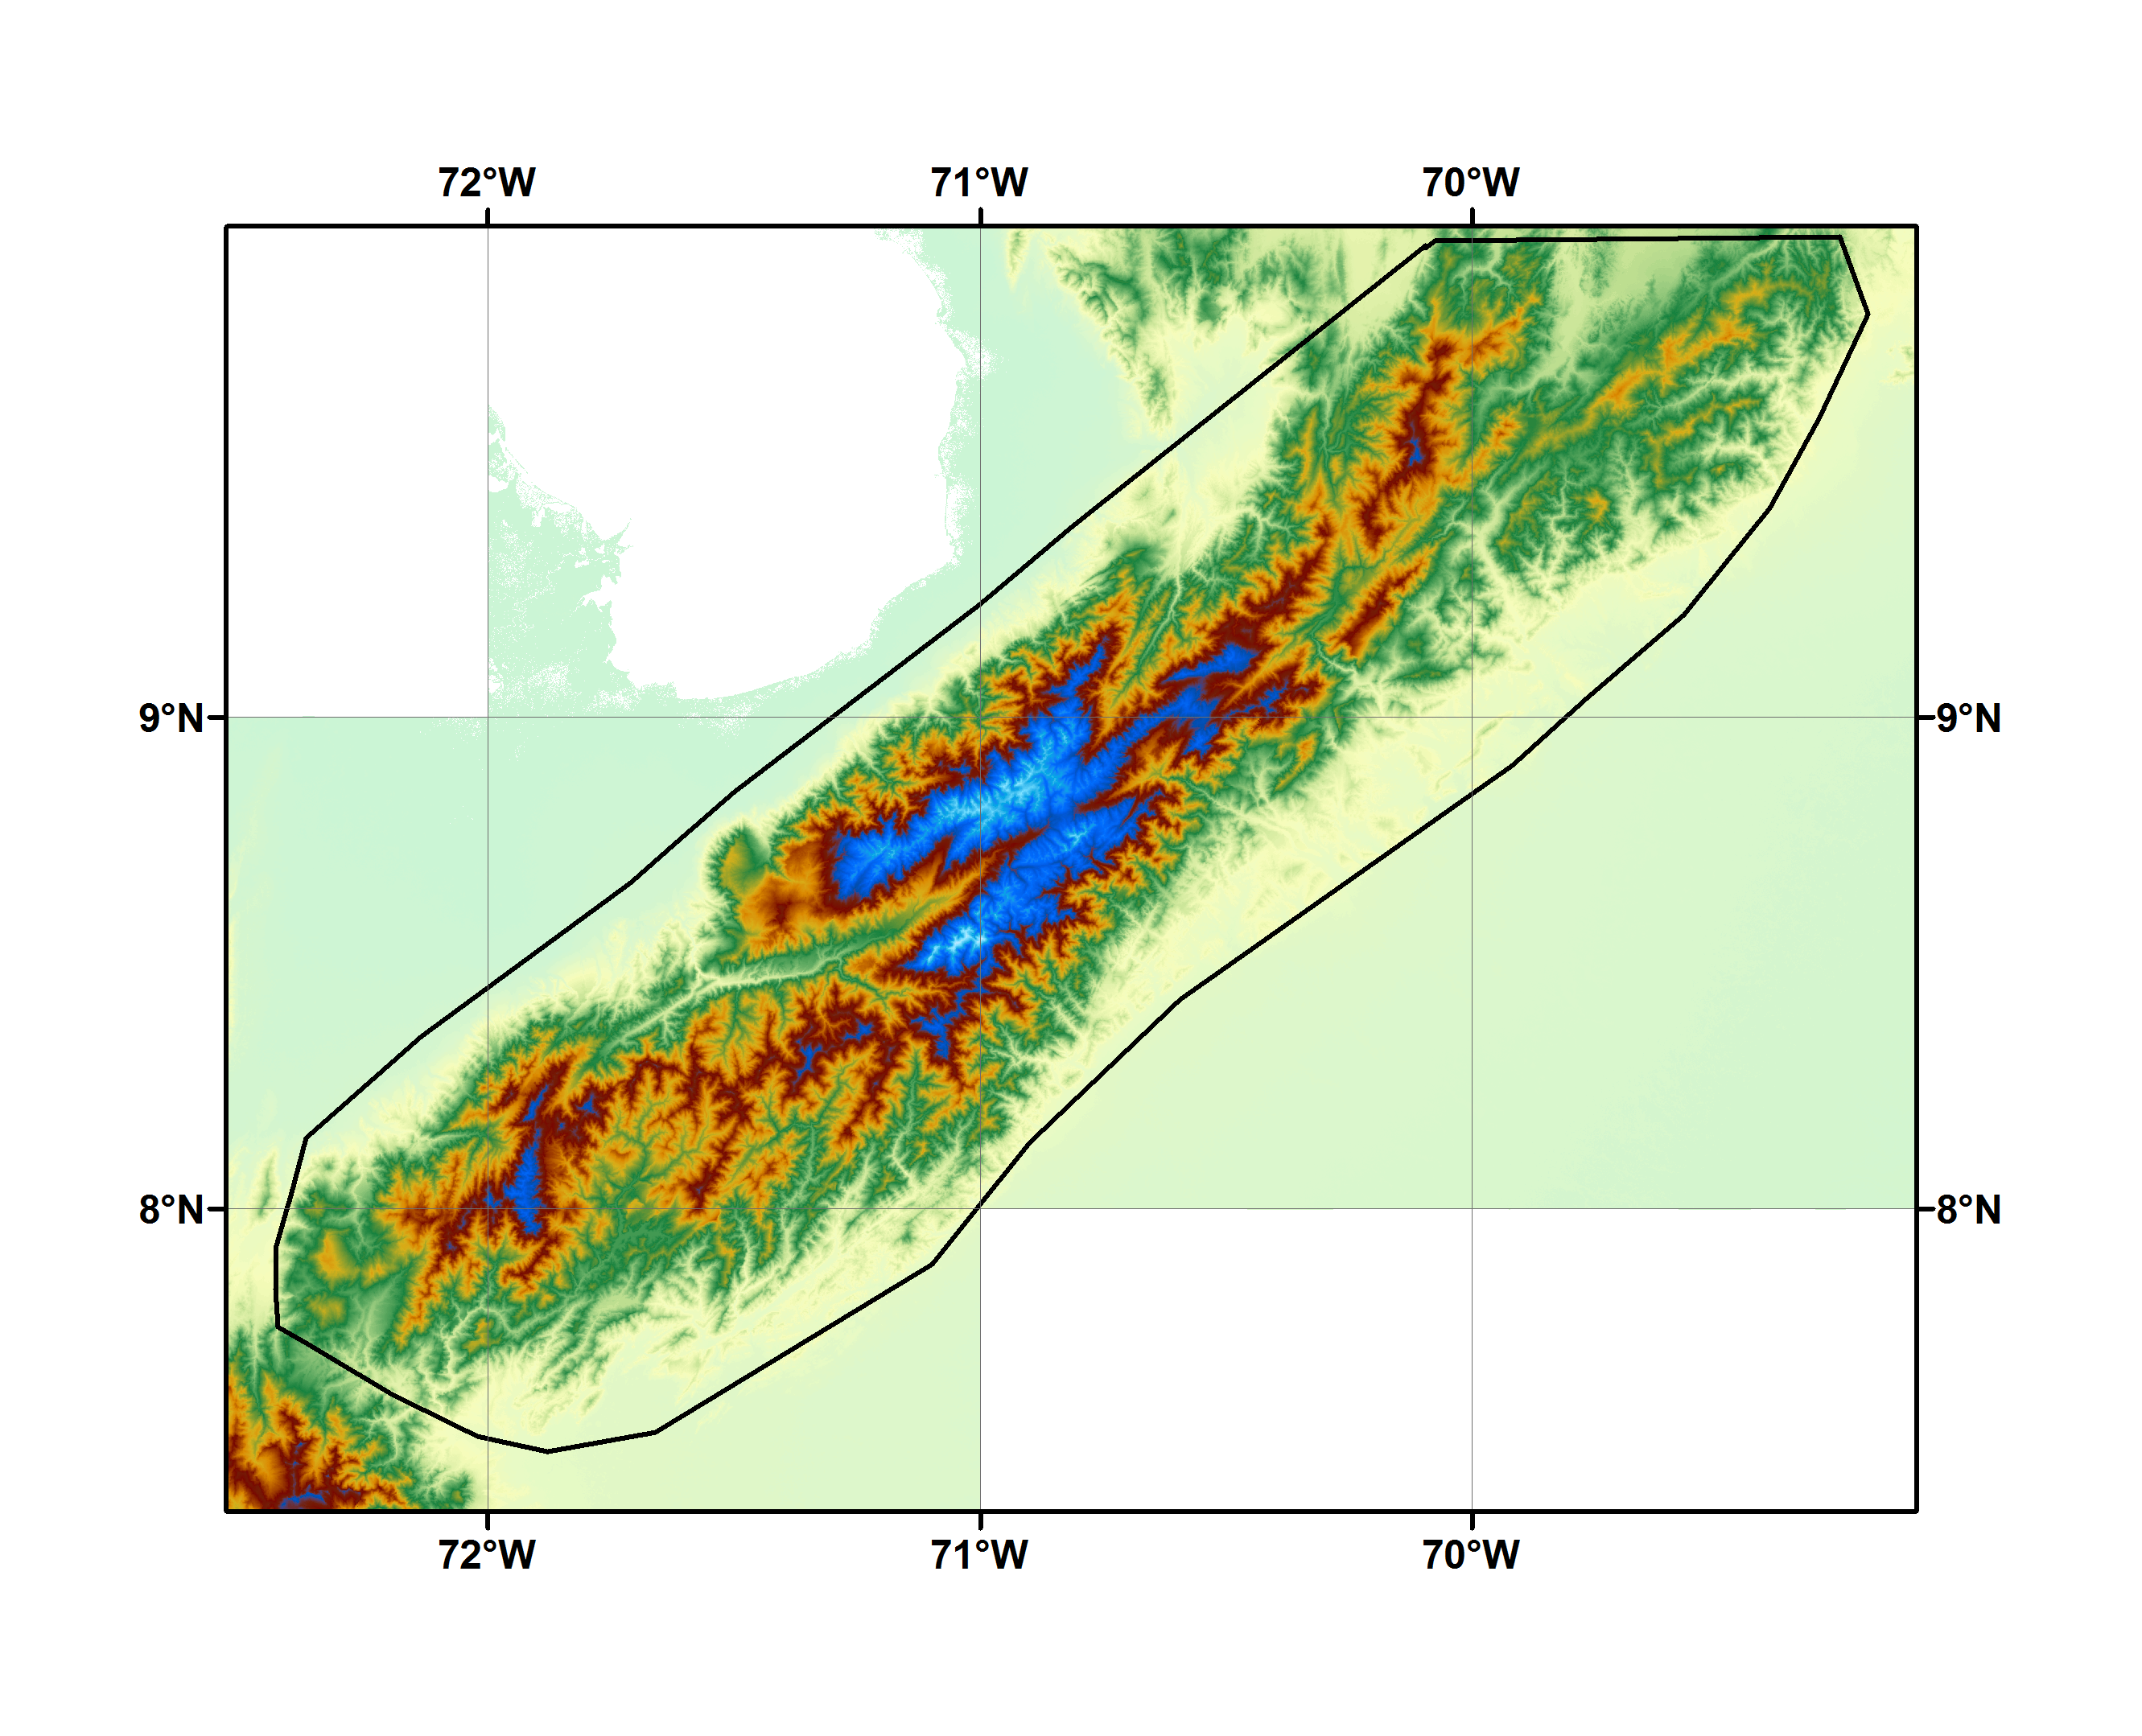
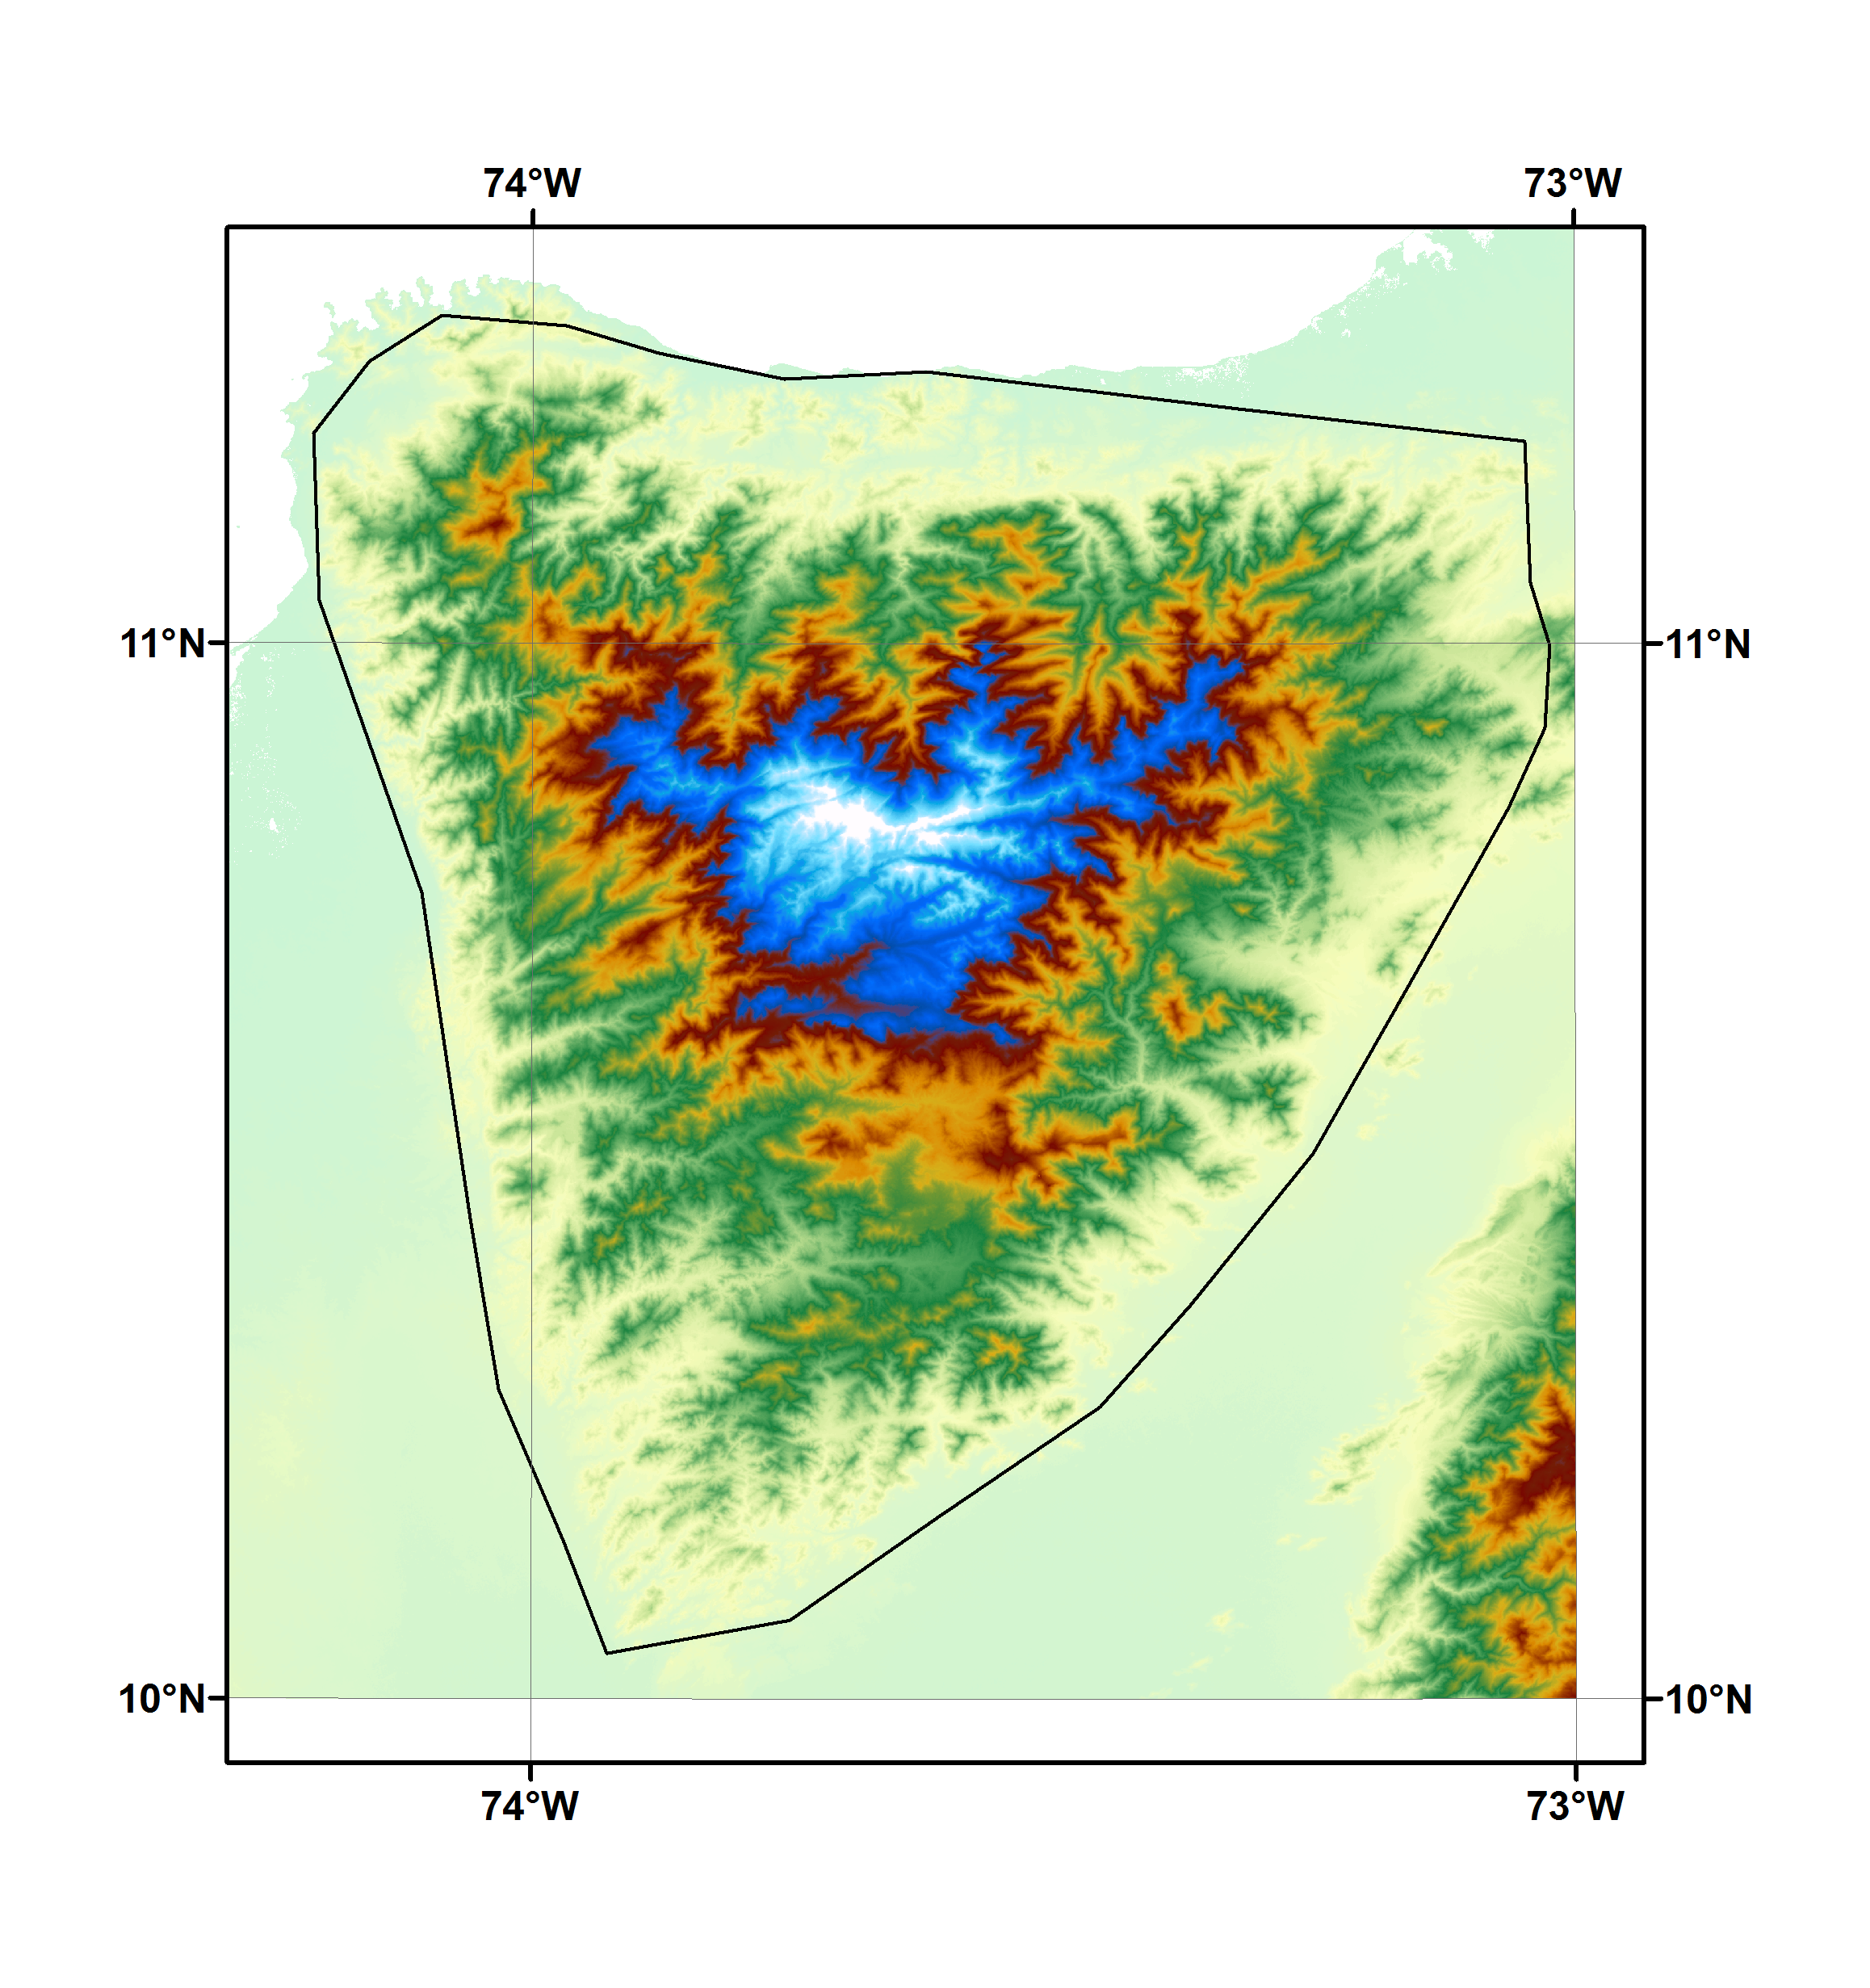
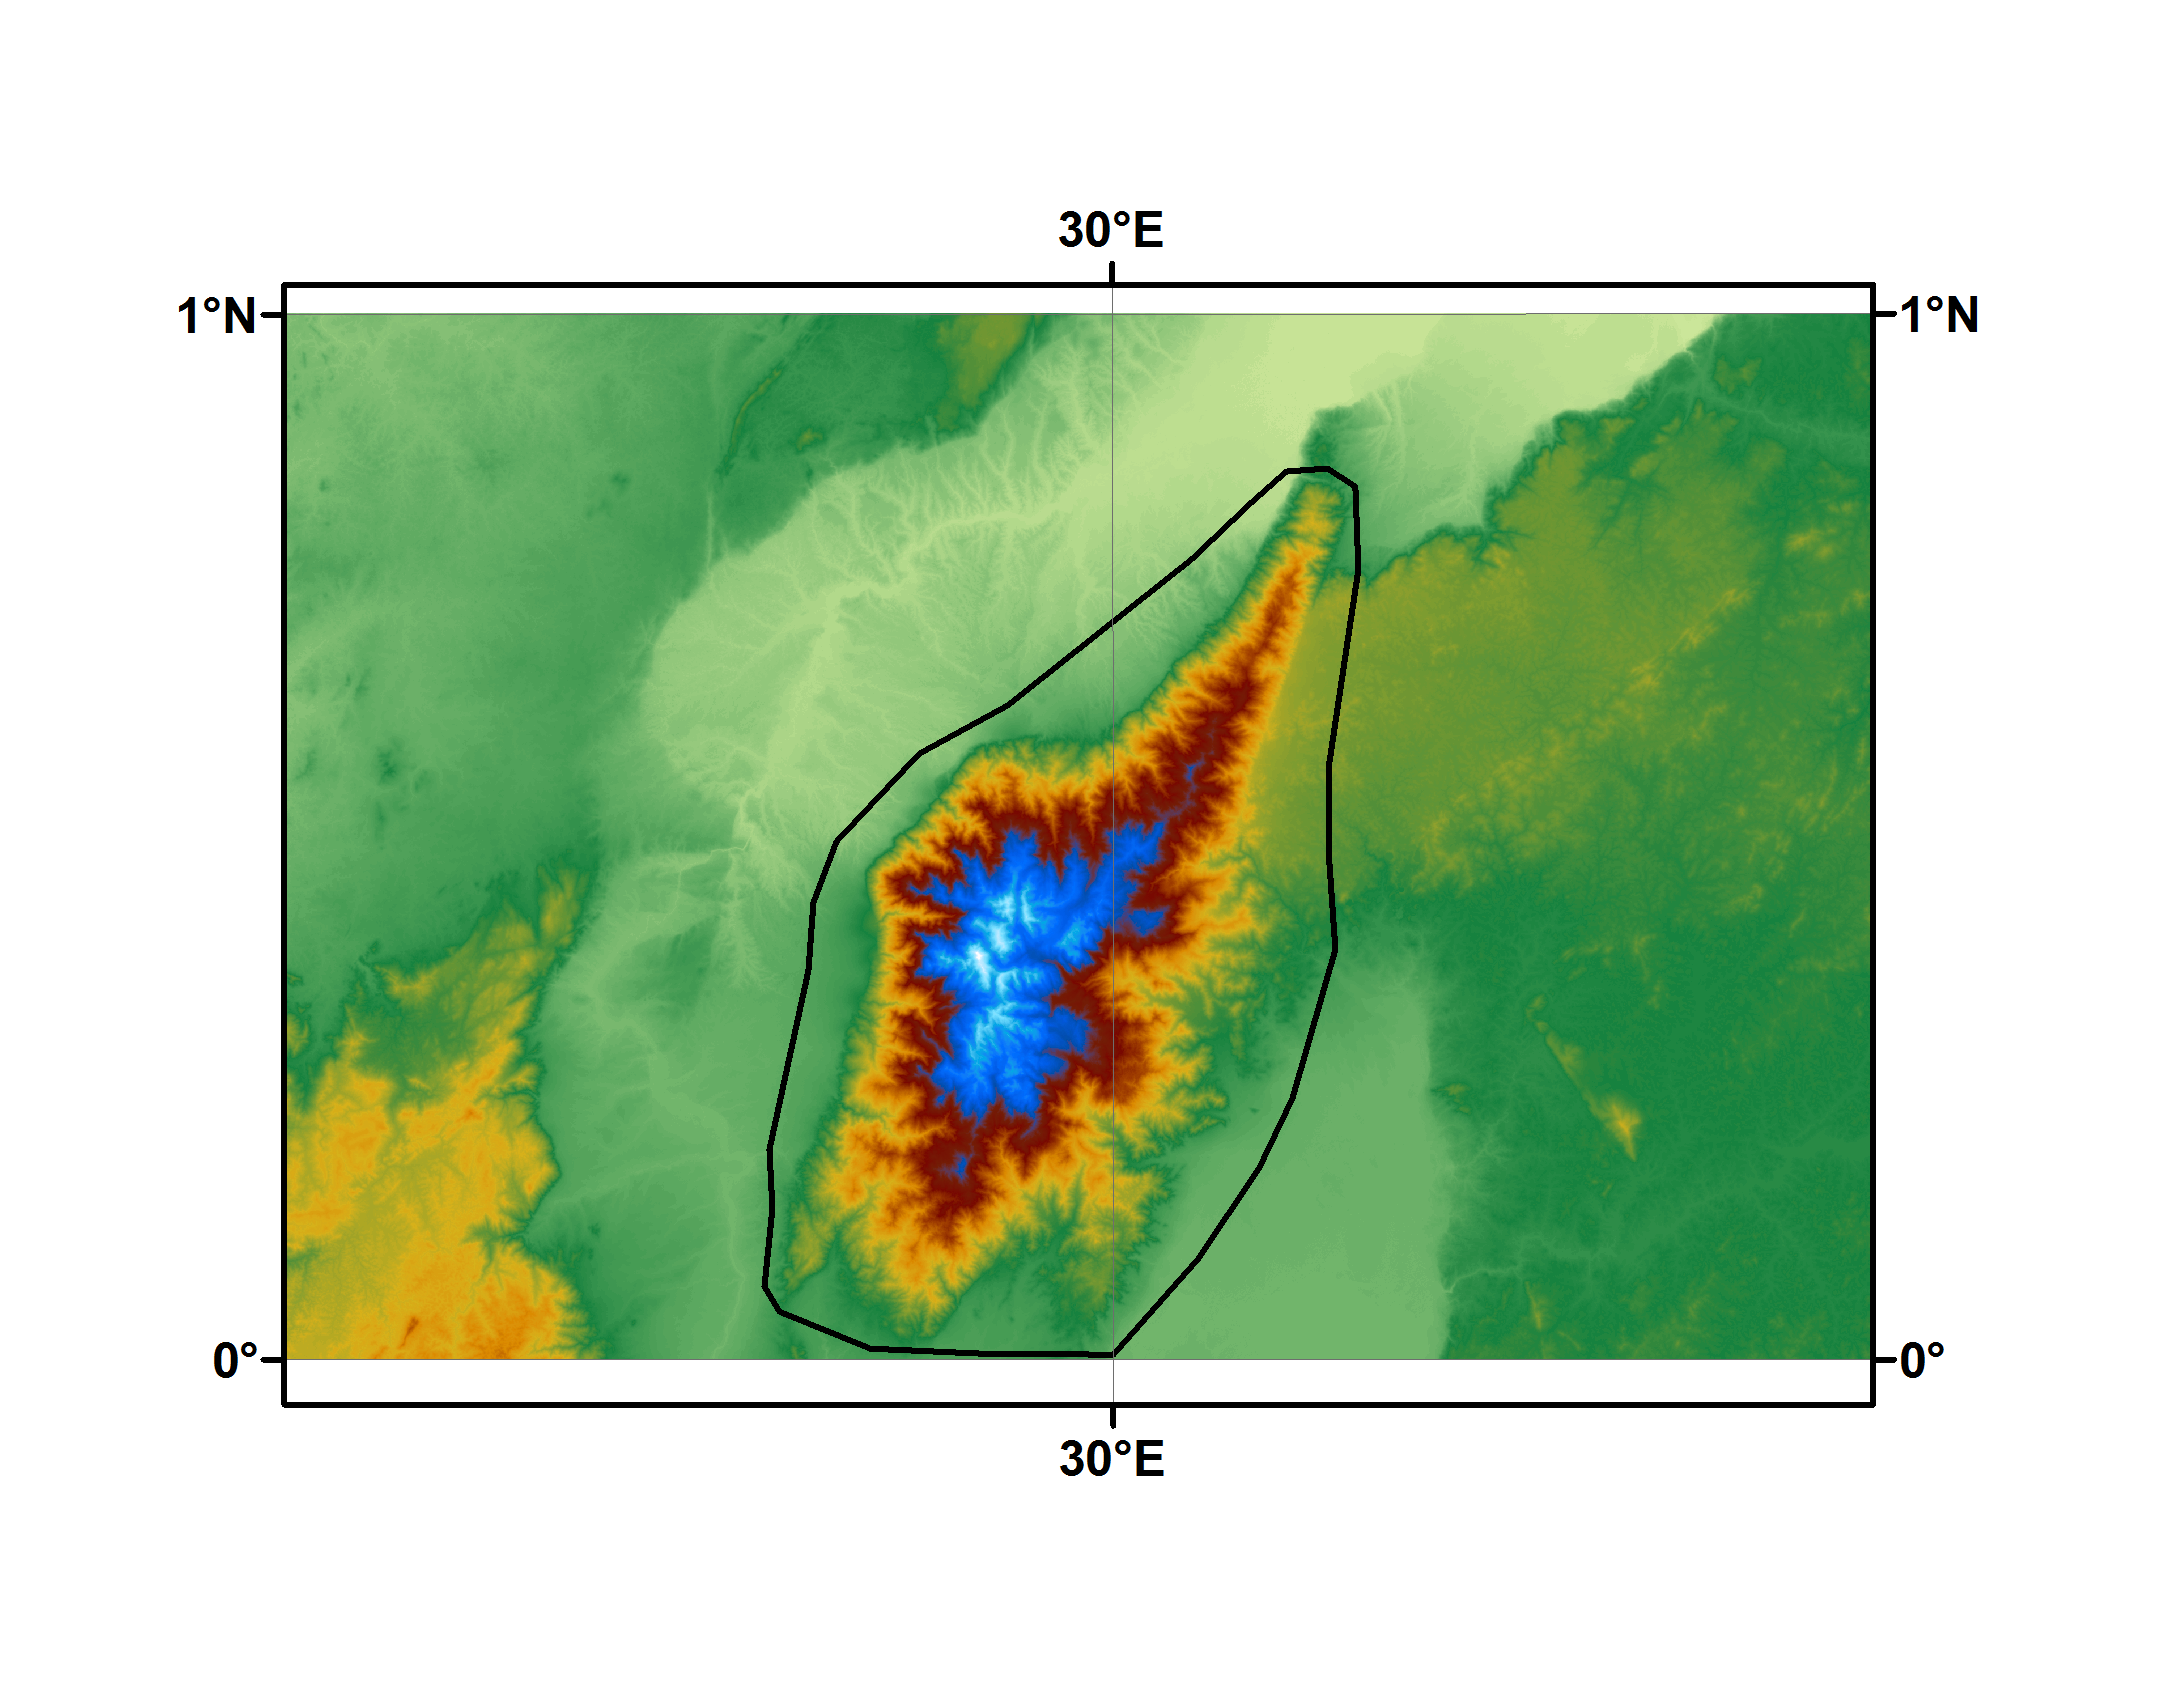
Mountain range DEMs are constructed from 1-arcsecond SRTM digital topography, which are available in 1° latitude x 1° longitude tiles. These tiles are mosaicked together to make the DEMs you see below. The color ramp for each DEM is pastel BYG from 0 to 500 m ASL, then GYR from 500 m - 3400 m ASL. The color ramp switches to dark blue-through-light blue from 3400-4500 m, representing the typical range of tropical snowlines (glacial equilibirum altitude, ELA). Area above the ELA band is white.
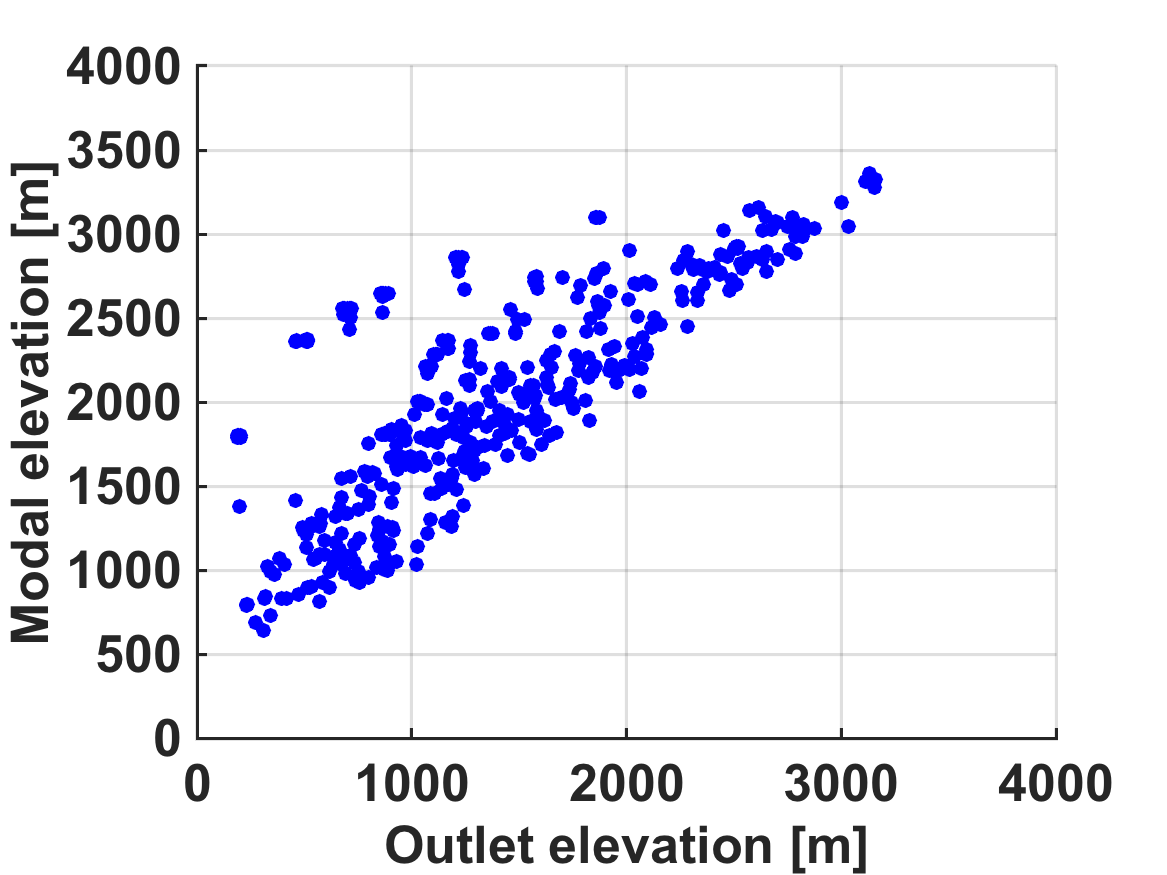
Leuser Range, Aceh, Indonesia
- Script to run the analysis in Matlab
- Subcatchments
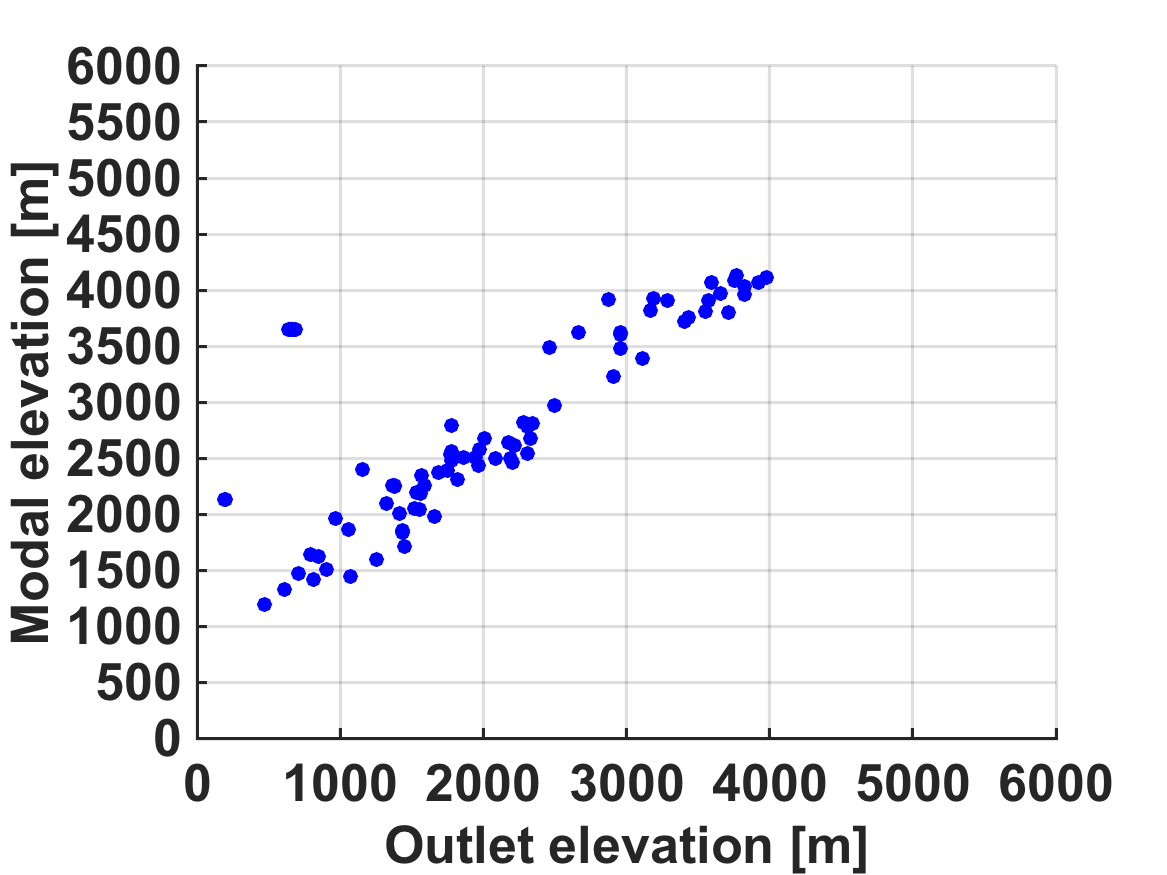
- PHBs
- Figures
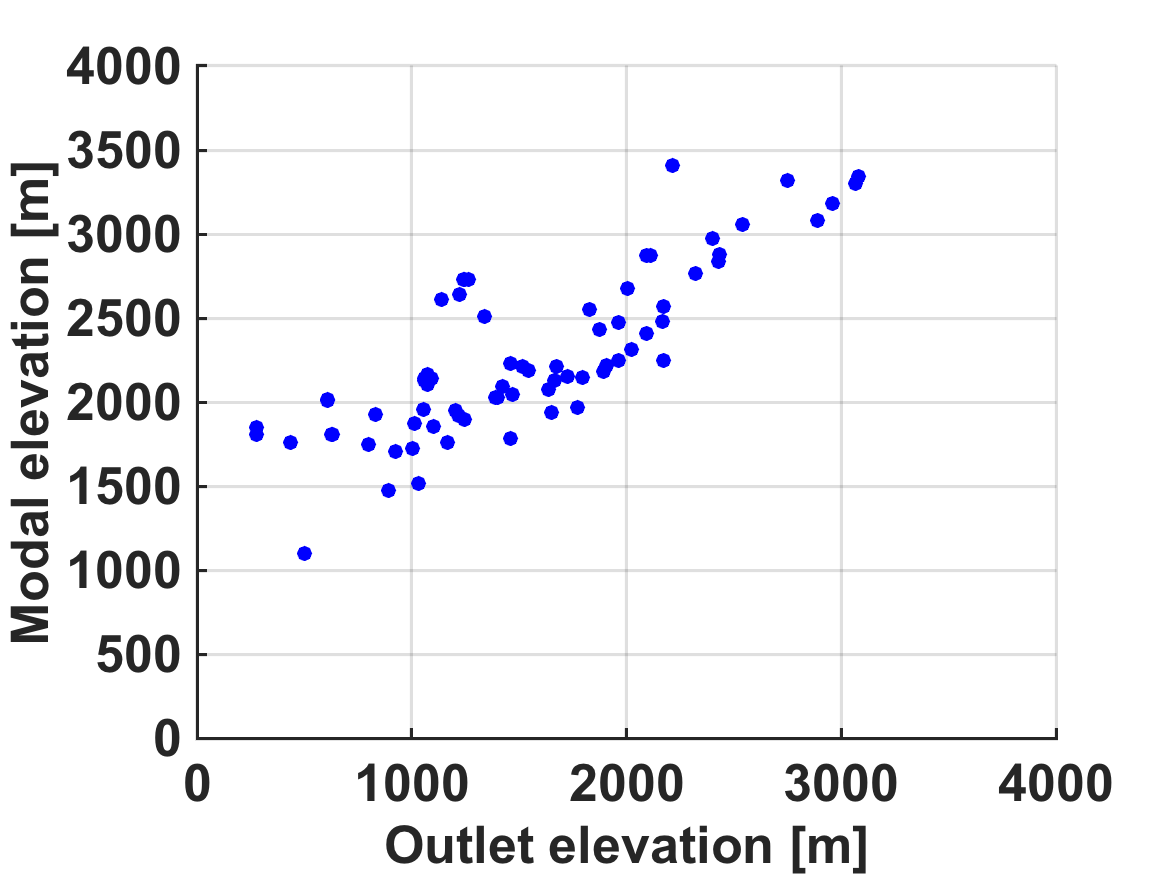
Central Range, Taiwan
- Script to run the analysis in Matlab
- Subcatchments
- PHBs
- Figures
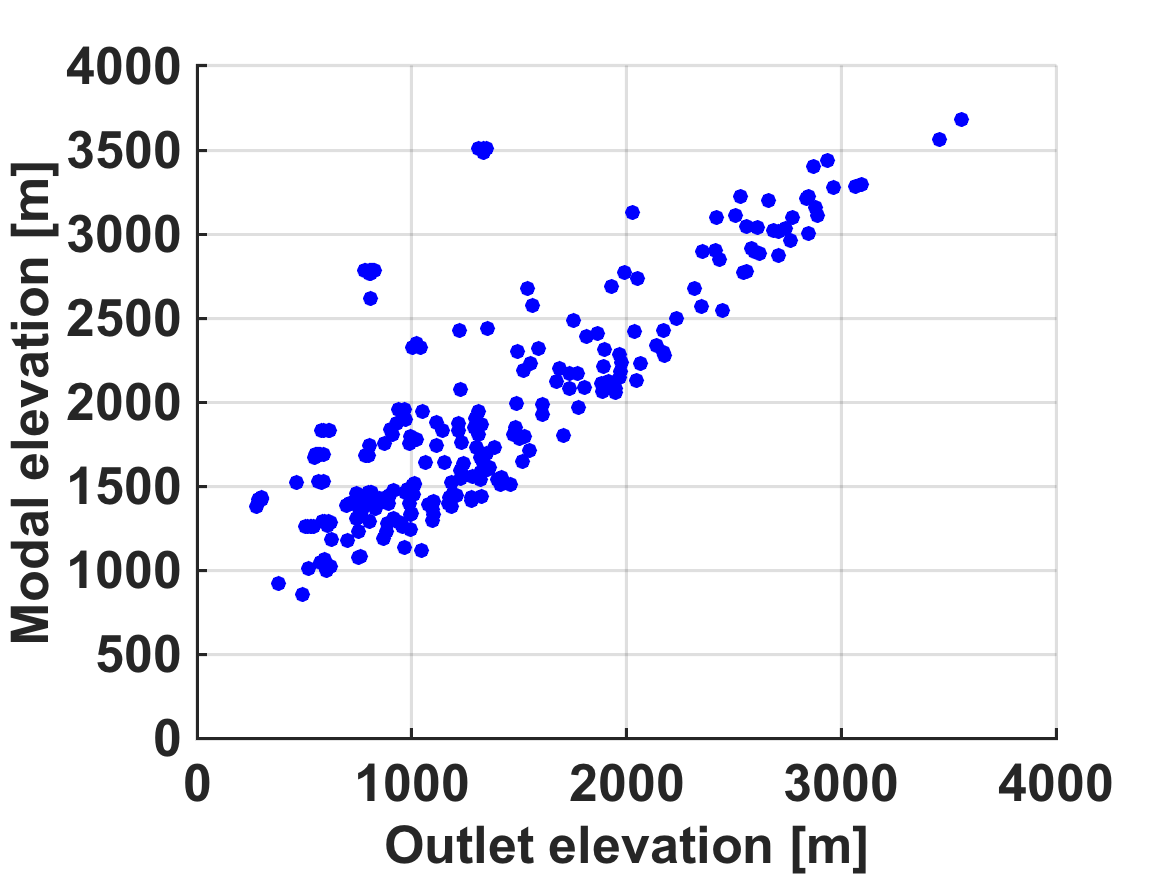
Talamanca Range, Costa Rica
- Script to run the analysis in Matlab
- Subcatchments
- PHBs
- Figures
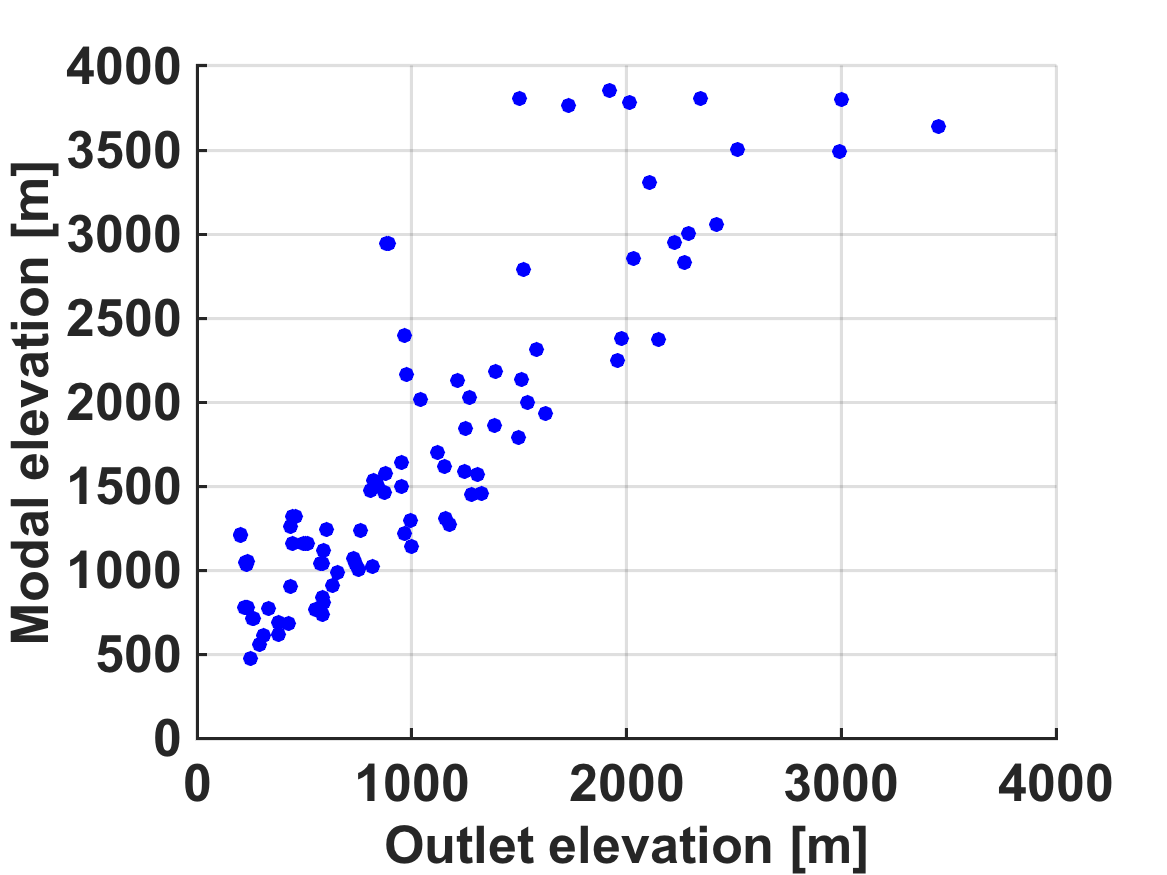
Crocker Range, Borneo
- Script to run the analysis in Matlab
- Subcatchments
- PHBs
- Figures
Finisterre Range, Papua New Guinea
- Script to run the analysis in Matlab
- Subcatchments
- PHBs
- Figures
Owen Stanley Range, Papua New Guinea
- Script to run the analysis in Matlab
- Subcatchments
- PHBs
- Figures
Merauke Range, Papua
- Script to run the analysis in Matlab
- Subcatchments
- PHBs
- Figures
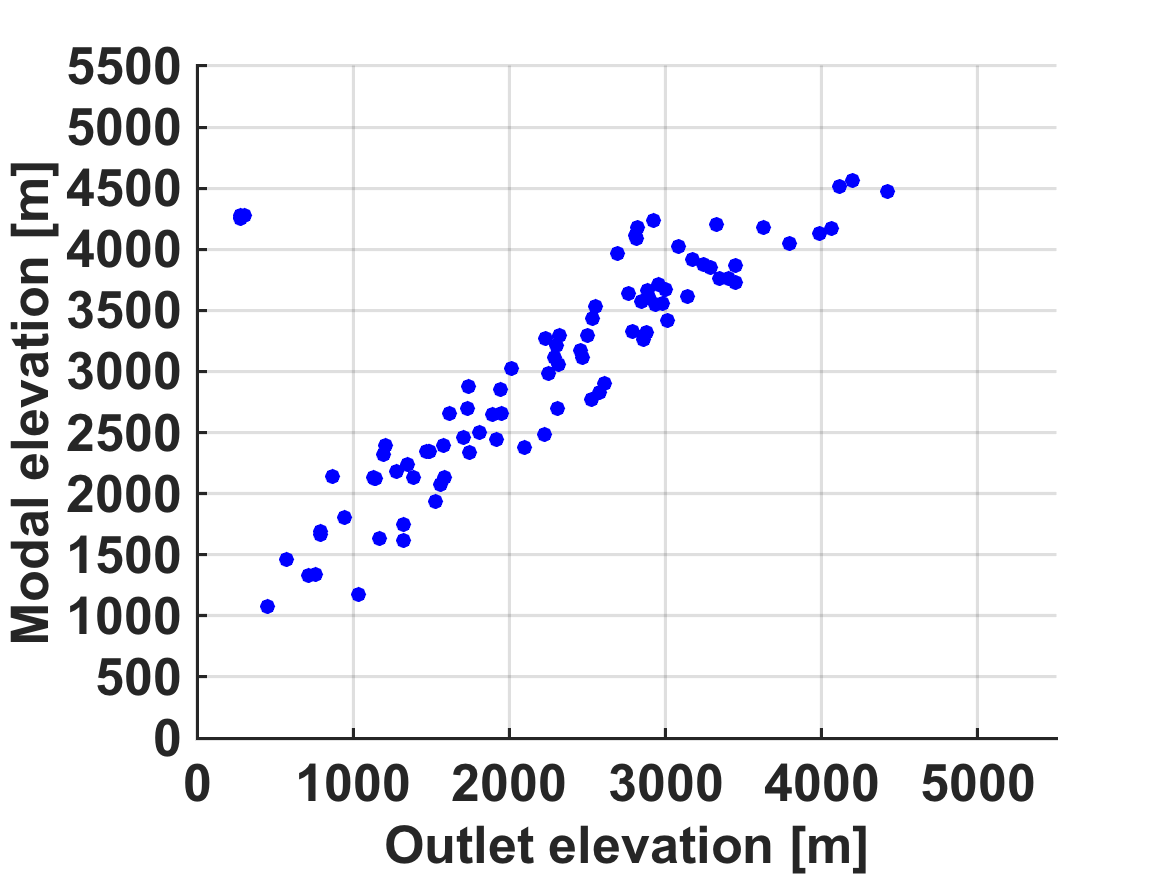
Mérida Range, Venezuela
- Script to run the analysis in Matlab
- Subcatchments
- PHBs
- Figures
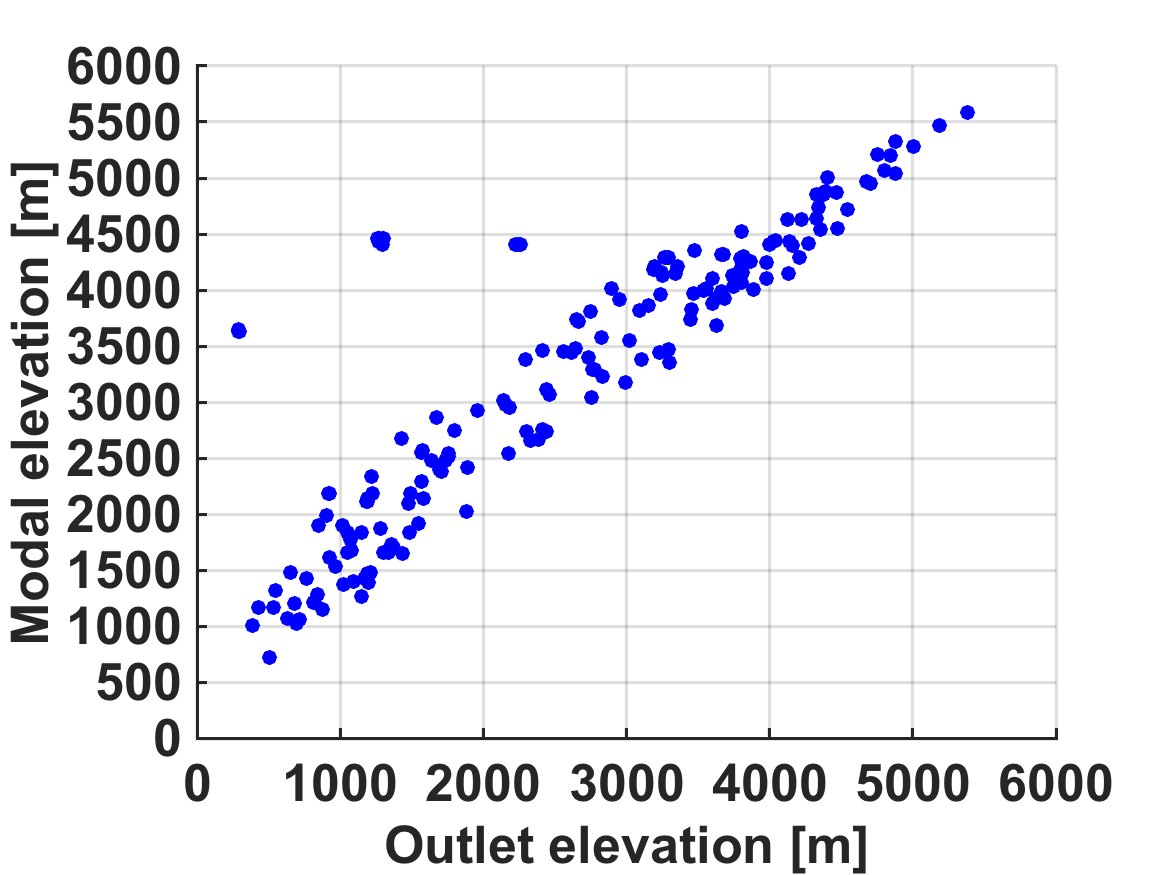
Sierra Nevada de Santa Marta, Colombia
- Script to run the analysis in Matlab
- Subcatchments
- PHBs
- Figures
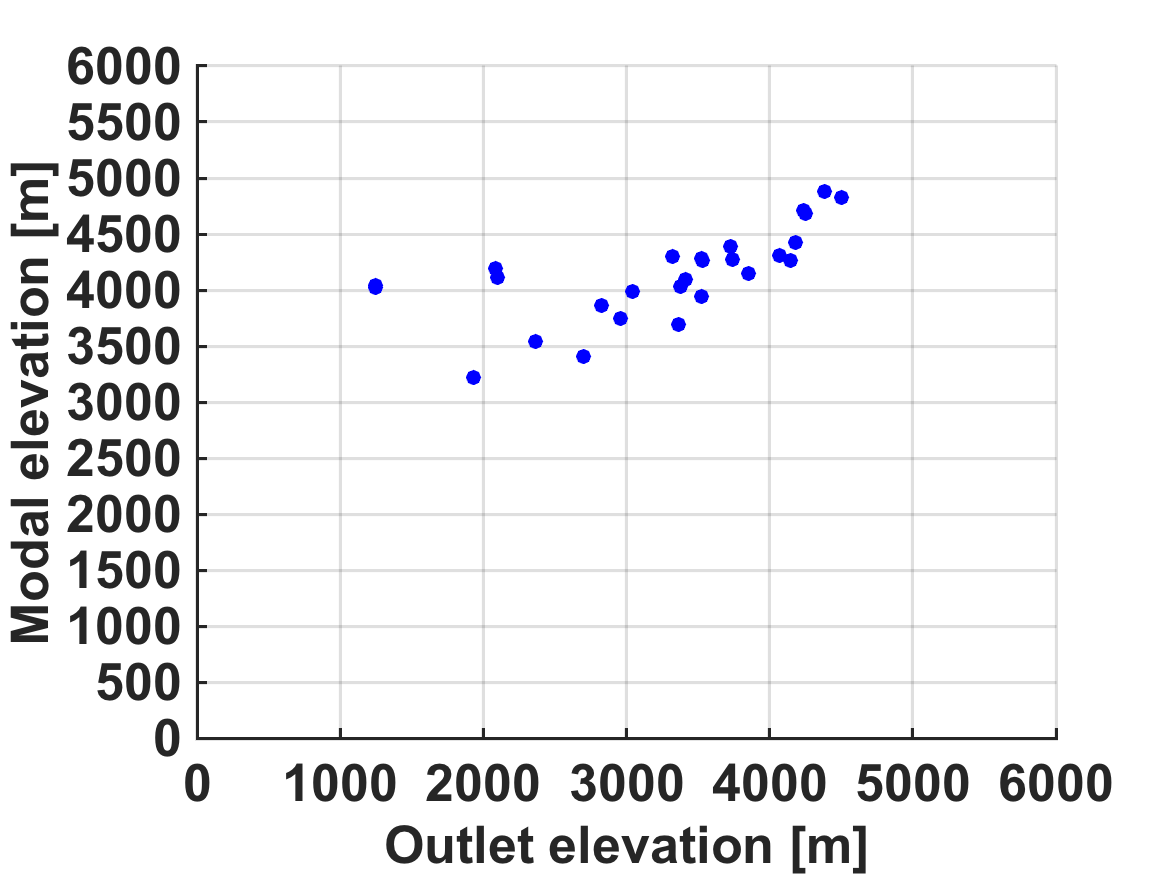
Rwenzori, East Africa
- Script to run the analysis in Matlab
- Subcatchments
- PHBs
- Figures